
- Title
-
A Novel Role for Lh3 Dependent ECM Modifications during Neural Crest Cell Migration in Zebrafish
- Authors
- Banerjee, S., Isaacman-Beck, J., Schneider, V.A., and Granato, M.
- Source
- Full text @ PLoS One
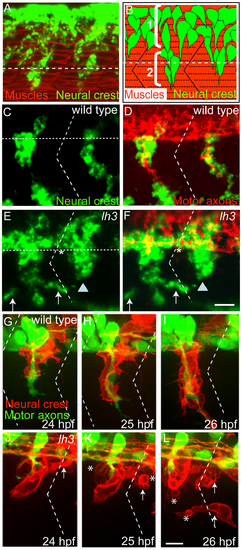
The role of lh3 signaling in neural crest cell migration. (A) Lateral view of a 22 hour old embryo stained with the pan-neural crest cell marker crestin (riboprobe, in green) marking neural crest cells, and with F59 antibody marking adaxial muscle cells. (B) Schematic diagram showing two modes of zebrafish neural crest cell migration: 1) sheet-like, non segmental and 2) stream-like, segmental. Neural crest cells (green) migrate through a central region of each somite after forming segmental streams (red). White horizontal dashed lines in A, B, C and E indicate approximate position of the ventral boundary of the neural tube. (C and D) Lateral view of a 28 hpf embryo stained with crestin (green) and the motor neuron maker antibodies (Znp1 and SV2; red). Horizontal dotted lines in A indicate the ventral boundary of the neural tube. E and F show lateral views of lh3 mutant embryos stained with crestin and motor neuron markers. Arrows in E and F point to neural crest cells near the somite boundaries. Asterisks marks neural crest cells forming sheet between two adjacent hemisegments. G–L shows still images from time lapse movies recorded from embryos expressing membrane bound RFP (Tg[sox10:mrfp]) in neural crest cells and GFP in motor neurons (Tg[mnx1:gfp]). In wildtype embryos (G–I), neural crest cells always migrate mid-segmentally along with motor axons. In lh3 mutant embryos (J–L), neural crest cells migrate along with motor axons mid-segmentally and in the region near segment/somite boundary (arrows). Neural crest cells in lh3 mutants also acquire a rounded morphology (asterisks). Oblique dotted lines in C to L indicate position of the somite/segment boundary. Scale bars:10 micron. EXPRESSION / LABELING:
PHENOTYPE:
|
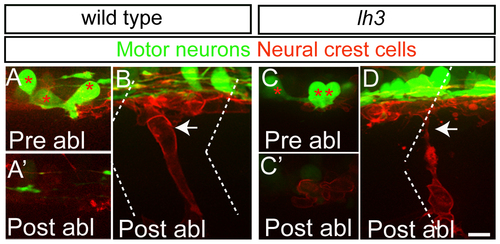
Motor axon independent role of lh3 signaling in neural crest cell migration. (A and D) Lateral view of double transgenic embryos (Tg[sox10:mrfp];Tg[mnx1;gfp] expressing mRFP in neural crest cells and GFP in neurons. Pre ablation (A) and post ablation (A′) view of motor neurons and neural crest cells in wildtype embryos. Neural crest cells were able to migrate through the mid-segmental region 4 hours following motor neuron ablation (B). In lh3 mutants (C- pre ablation, C′30 min post ablation, D- 4 hours post ablation), neural crest cells migrated in the region overlying somite/segment boundary in the absence of motor neurons. Scale bar- 10 micron. EXPRESSION / LABELING:
|
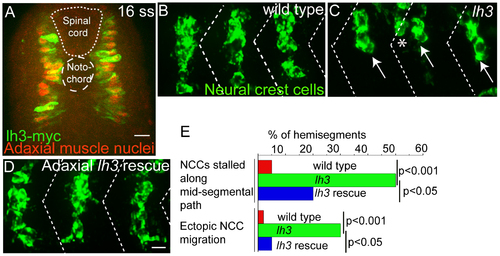
Lh3 activity in adaxial cells can rescue neural crest cell migration defects in lh3 mutants . Cross sectional view of 16 somite stage [Tg(smhc1:lh3-myc)] embryos showing expression of lh3-myc transgene (green) in prox-1 (red) positive adaxial cells. Lateral view of an 28 hour old lh3 sibling embryo (B), lh3 mutant (C) and an lh3 mutant embryo expressing lh3-myc in adaxial muscle cells (D), all stained with crestin (green). Note the stalled neural crest cells in the mid-segmental and neural crest cells in the hemisegment region in lh3 mutants (arrows and asterisks in C). These defects were rescued in by expressing lh3-myc in adaxial cells of lh3 mutants (C). (E) Quantification of neural crest cell migration defects. P values (** p<0.001; * p<0.05) were obtained using Chi- Square test. Scale bar-10 micron. EXPRESSION / LABELING:
PHENOTYPE:
|
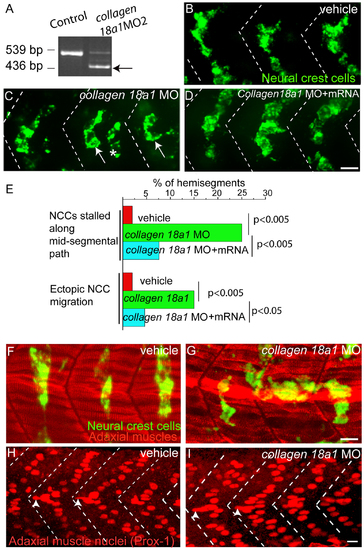
Knockdown of collagen18a1 results in neural crest cell migration defects. (A) RT PCR analysis showing efficiency of collagen18a1 knockdown following morpholino treatment. Arrow marks the expected band following morpholino treatment sized at 439 base pairs. Lateral views of 28 hpf vehicle (B) collagen18a1 MO (C) and collagen18a1 MO plus collagen18a1 mRNA injected embryo (D), stained with crestin to visualize neural crest cells. Arrows indicate neural crest cells stalled along the mid-segmental path (C), and asterisks indicate neural crest cells along the ectopic path. (C, E) (E) Quantification of neural crest cell migration defects in collagen18a1 MO injected embryos. p values were calculated using one tailed Fisher Exact Probability test. Vehicle injected and collagen18a1(G) MO injected embryos, stained with F59 to visualize adaxial cells (red), and crestin to visualize neural crest cells (green) (F–G) and with prox-1 antibody (H–I). Arrowheads mark adaxial cell nuclei located anteriorly near horizontal myoseptum region (H–I). Scale bar-10 micron. |