
- Title
-
Wnt/beta-catenin signaling cell-autonomously converts non-hepatic endodermal cells to a liver fate
- Authors
- So, J., Martin, B.L., Kimelman, D., and Shin, D.
- Source
- Full text @ Biol. Open
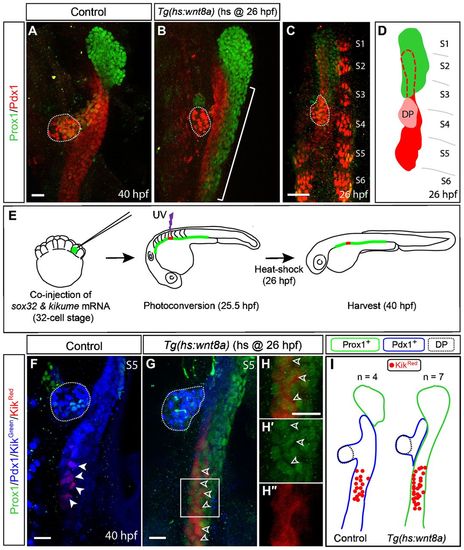
Non-hepatic endodermal cells are directly converted into hepatoblasts upon Wnt8a overexpression. (A,B) Wild-type or Tg(hs:wnt8a) embryos were heat-shocked at 26hpf, harvested at 40hpf, and processed for immunostaining with anti-Prox1 (green) and anti-Pdx1 (red) antibodies. Ectopic hepatoblasts were present in the endoderm posterior to the liver-forming region in Wnt8a-overexpressing embryos (B, bracket). (C,D) anti-Prox1 and anti-Pdx1 staining of wild-type embryos at 26hpf and a schematic representation. Prox1 is expressed in endodermal cells at the 1st to 3rd somite levels, but not at the 4th to 6th somite levels. S1–S6 denotes the 1st–6th somite; the pink region indicates the dorsal pancreas (DP). Dashed lines in D outline the Pdx1+ region beneath the liver. (E) Cartoons illustrating cell-lineage tracing experiments. (F,G) Wild-type or Tg(hs:wnt8a) embryos were co-injected with sox32 and kikume mRNA into a single cell at the 32-cell stage, resulting in the mosaic expression of Kikume in the endoderm. Endodermal cells at the 5th somite level were photoconverted at 25.5hpf and then heat-shocked. Excited cells emit red fluorescence (KikRed) instead of green (KikGreen). The embryos were harvested at 40hpf and processed for immunostaining. To reveal the entire endoderm morphology including the dorsal pancreas (dotted lines), both Pdx1 and Kikgreen expression, which was detected using the same laser, are shown. KikRed+ cells expressed Prox1 (green) in Wnt8a-overexpressing embryos (G, open arrowheads), but not in controls (F, arrowheads). (H–H3) Higher magnification images of the square region in G. (I) Cartoon incorporating all lineage-tracing data. Green and blue lines outline Prox1+ and Pdx1+ domains, respectively, and n indicates the number of embryos. Dotted lines outline the dorsal pancreas (DP). All confocal images are ventral views with anterior up. Scale bars, 20µm. |
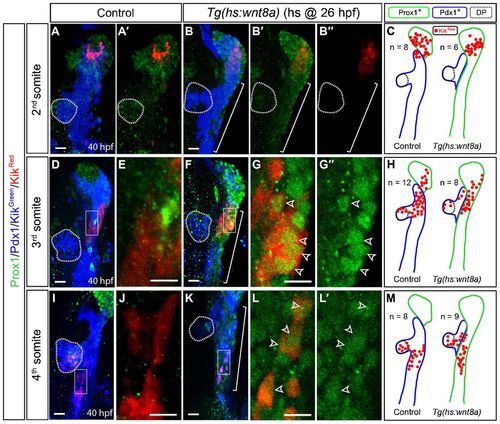
Wnt8a overexpression does not induce the posterior migration of hepatoblasts. The lineage of endodermal cells at the 2nd, 3rd, or 4th somite level was traced. (A–C) Lineage tracing of endodermal cells at the 2nd somite level. The distribution of KikRed+ cells in control is similar to that in Wnt8a-overexpressing embryos. Cartoons incorporating all lineage-tracing data (C). (D–H) Lineage tracing of endodermal cells at the 3rd somite level. Most KikRed+ cells expressed Prox1 (green) in Wnt8a-overexpressing embryos (G, open arrowheads), whereas a small number of KikRed+ cells did in controls (E). Higher magnification images of the square regions in D and F are shown in E and G, respectively, without Pdx1 and Kikgreen expression. (I–M) Lineage tracing of endodermal cells at the 4th somite. Many KikRed+ cells expressed Prox1 (green) in Wnt8a-overexpressing embryos (L, open arrowheads), whereas none of the cells did in controls (J). Higher magnification images of the square regions in I and K are shown in J and L, respectively, without Pdx1 and Kikgreen expression. Green and blue lines outline Prox1+ and Pdx1+ domains, respectively, and n indicates the number of embryos (C,H,M). Brackets delineate the endodermal region in which ectopic hepatoblasts are present (B–B3,F,K). Dotted lines outline the dorsal pancreas (DP). Ventral views, anterior up. Scale bars, 20µm. |
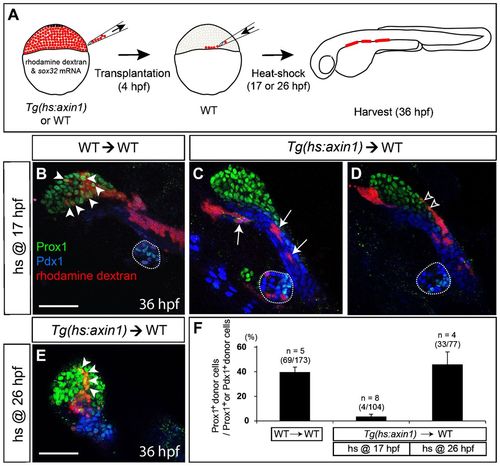
Endodermal cells with Wnt/β-catenin signaling repressed fail to contribute to the liver. (A) Cartoons illustrating transplantation experiments. Wild-type or Tg(hs:axin1) embryos were co-injected with sox32 mRNA and rhodamine dextran at the 1- to 4-cell stage. Donor cells from the injected embryos were transplanted into a wild-type embryo at 4hpf. The transplants were heat-shocked at 17 (B–D) or 26 (E) hpf, harvested at 36hpf, and processed for immunostaining. (B,C) Wild-type donor cells expressed Prox1 (green) in the liver-forming region (B, arrowheads), whereas Axin1-overexpressing donor cells heat-shocked at 17hpf expressed Pdx1 (blue) but not Prox1 (C, arrows). (D) A few Axin1-overexpressing donor cells were located at the margin of the liver-forming region (open arrowheads). (E) Axin1-overexpressing donor cells heat-shocked at 26hpf expressed Prox1 and were located in the liver-forming region (arrowheads). (F) Quantification of the transplantation experiments. Percentages of Prox1+ donor cells relative to Prox1+ or Pdx1+ donor cells are shown. Error bars represent the standard deviation; n indicates the number of embryos. Dotted lines outline the dorsal pancreas. Ventral views, anterior up (B–E). Scale bars, 50µm. |
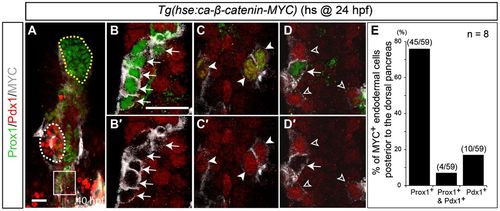
Wnt/β-catenin signaling cell-autonomously induces hepatoblasts. Tg(hse:ca-β-catenin-MYC) embryos were heat-shocked at 24hpf, harvested at 40hpf, and processed for anti-Prox1 (green), anti-Pdx1 (red) and anti-MYC (gray) staining. ca-β-catenin-expressing cells were detected by anti-MYC antibodies. (A,B) Most MYC+ cells in the endoderm posterior to the dorsal pancreas expressed Prox1 (B, arrows) but not Pdx1. Since the Prox1 antibody has a background staining problem, cytoplasmic or membrane-like staining is background staining, whereas nuclear Prox1 staining is real staining. White and yellow dotted lines in A outline the dorsal pancreas and liver, respectively. Higher magnification images of the square region in A are shown in B,B2. (C,C2) Some MYC+ cells expressed both Prox1 and Pdx1 (arrowheads). (D,D2) Weak MYC+ cells were Prox1/Pdx1+, whereas strong MYC+ cells were Prox1+/Pdx1 (open arrowheads versus arrow). Ventral views, anterior up. Scale bars, 20µm. (E) Quantification of MYC+ cells in the endoderm posterior to the dorsal pancreas based on Prox1 and Pdx1 expression. n indicates the number of embryos. EXPRESSION / LABELING:
|
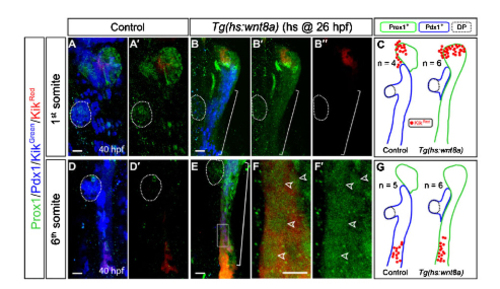
Wnt8a overexpression induces the direct conversion of non-hepatic endodermal cells into hepatoblasts, but not the posterior migration of hepatoblasts. Wild-type or Tg(hs:wnt8a) embryos were co-injected with sox32 and kikume mRNA into a single cell at the 32-cell stage. Endodermal cells at the 1st or 6th somite level were photoconverted at 25.5 hpf and then heat-shocked. The embryos were harvested at 40 hpf and processed for immunostaining. (A-C) Endodermal cells at the 1st somite level were photoconverted for lineage tracing. A′ and B′ images are the same as A and B, respectively, but without Pdx1 and Kikgreen expression. B′′ is the same image as B′ but without Prox1 expression. Cartoons incorporating all lineage-tracing data (C) show that the posterior migration of hepatoblasts in the liver-forming region did not occur in Wnt8a-overexpressing embryos. (D-G) Endodermal cells at the 6th somite were photoconverted for lineage tracing. KikRed+ cells expressed Prox1 (green) in Wnt8a-overexpressing embryos (F, open arrowheads), but not in controls (D′). Higher magnification images of the square region in E are shown in F without Pdx1 and Kikgreen expression. F′ is the same image as F but without Prox1 expression. Cartoons incorporating all lineage-tracing data (G) show that non-hepatic endodermal cells were converted into hepatoblasts upon Wnt8a overexpression. Green and blue lines outline Prox1+ and Pdx1+ domains, respectively, and n indicates the number of embryos (C,G). Dotted lines outline the dorsal pancreas (DP), and brackets delineate the endode rmal region in which ectopic hepatoblasts are present. All confocal images are ventral views with anterior up. Scale bars, 20 µm. |
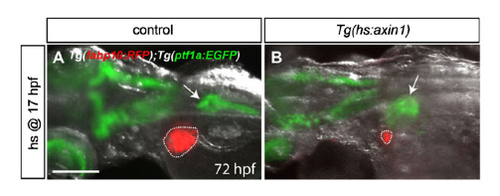
Axin1 overexpression greatly reduces liver size. ( A , B ) The Tg(fabp10:RFP) and Tg(ptf1a:EGFP) lines were used to reveal hepatocytes (red) and ventral pancreatic cells (green), respectively. Control and Tg(hs:axin1) embryos were heat-shocked at 17 hpf and harvested at 72 hpf. Liver size was greatly reduced in Axin1-overexpressing embryos compared to controls (B versus A, dotted lines). Arrows point to the pancreas. Dorsal views, anterior to the left. Scale bar, 200 u m. |