
- Title
-
Reverse Genetics Screen in Zebrafish Identifies a Role of miR-142a-3p in Vascular Development and Integrity
- Authors
- Lalwani, M.K., Sharma, M., Singh, A.R., Chauhan, R.K., Patowary, A., Singh, N., Scaria, V., and Sivasubbu, S.
- Source
- Full text @ PLoS One
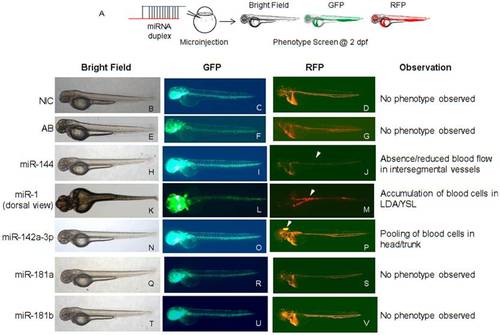
Overexpression of miRNAs in zebrafish embryos induces specific vascular phenotypes. A - Schematic of the experimental approach. MiRNA duplexes were ectopically overexpressed in Tg(fli1:EGFP, gata1a: dsRed) zebrafish embryos through microinjection at 1–2 cell stage. The injected embryos were scored at 2 dpf under microscope for visual observation of phenotype under bright field, GFP and RFP filters. Representative images of miRNA-injected Tg(fli1:EGFP, gata1a: dsRed) zebrafish embryos are displayed. B,C,D - Non-injected control (NIC) zebrafish embryos with normal vascular development. E,F,G - Zebrafish embryos injected with miRNA annealing buffer display normal vascular development. H,I,J - Zebrafish embryos injected with miR-144 display reduced or absence of blood in intersegmental vessels. K,L,M - Zebrafish embryos injected with miR-1 display accumulation of blood cells in LDA/YSL. N,O,P - Zebrafish embryos injected with miR-142a-3p display pooling of blood cells in head/trunk region. Q,R,S and T,U,V - Zebrafish embryos injected with miR-181a and miR-181b respectively display no visible phenotype. Zebrafish embryos injected with miR-221, miR-222 and miR-451 display no observable phenotype (figure not shown). Arrowheads indicate the site of vascular defects. The embryos were imaged at 2.5× magnification. |
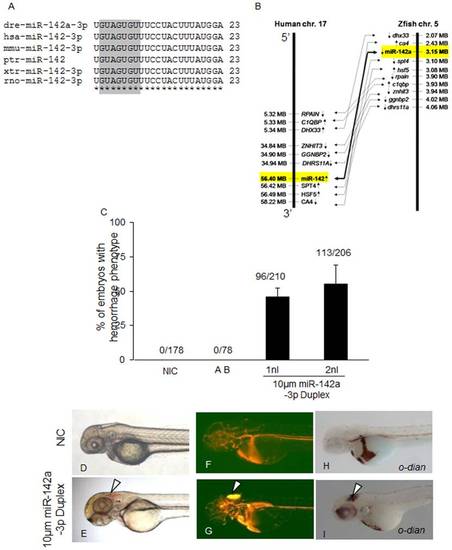
Overexpression of miR-142a-3p in zebrafish embryos induces hemorrhage and vascular remodeling. A - Sequence alignment of mature miR-142a-3p from different species is highlighted with seed sequence in gray color. B – Synteny analysis of human miR-142 on chromosome 17 with zebrafish miR-142a on chromosome 5. Arrow in genes indicates strand information on chromosome. C - Bar graph showing cerebral hemorrhage phenotype in miR-142a-3p duplex injected Tg(fli1:EGFP, gata1a: dsRed) zebrafish embryos at 2 dpf. Data is represented as mean percentage ± SD (standard deviation) collected over 3 independent experiments and n is number embryos analyzed. D - I - Representative image of cerebral hemorrhage phenotype in Tg(fli1:EGFP, gata1a: dsRed) zebrafish embryos at 2 dpf. D,F,H - Non-injected control embryos (NIC) and E,G,I - miR-142a-3p injected embryos. H,I - Embryos stained with o-dianisidine. D–I - 2.5× magnification. |
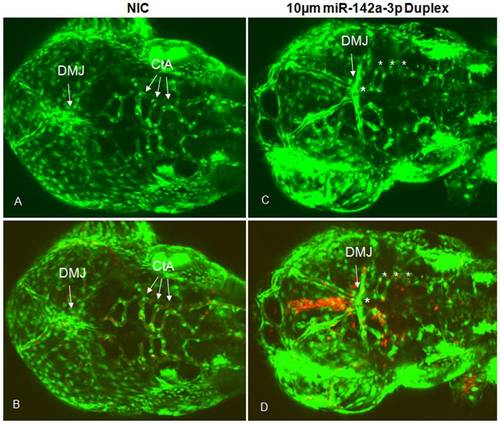
Overexpression of miR-142a-3p in zebrafish embryos induces vascular defects. A – D - Confocal images (GFP and GFP/RFP merged) of 10 μM miR-142a-3p duplex injected Tg(fli1:EGFP, gata1a: dsRed) embryos at 2 dpf (Dorsal View of head) depicting dorsal midbrain junction (DMJ) and central arteries (CtA) (10× magnification). A, B - non-injected control embryos and C, D - 10 μM miR-142a-3p duplex injected embryos. A, C – GFP, B, D – GFP/RFP merged. Asterisk sign indicate the site of vascular defect. |
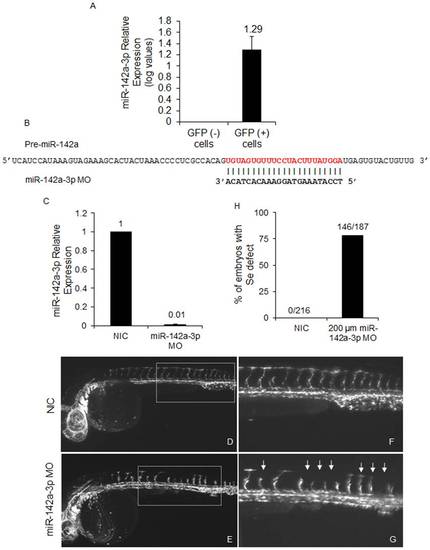
Loss of miR-142a-3p leads to intersegmental vessel remodeling. A –Relative quantification of miR-142a-3p in GFP positive (+) and GFP negative (-) cells of 2 dpf Tg(fli1:EGFP, gata1a: dsRed) zebrafish embryo by real-time PCR. Total RNA was isolated from 2 dpf FAC sorted GFP (-) and GFP (+) cells of 2 dpf Tg(fli1:EGFP, gata1a: dsRed) zebrafish embryos. 200 ng of total RNA was used for preparing cDNA using QuantiMir kit, SBI, USA and diluted by 1:1 for RT-PCR assay. The assay has been performed using ΔΔCT method (ΔΔCT = (CT miRNA - CT reference RNA) - (CT calibrator - CT reference RNA) as described previously [45]. U6 and beta-actin was used as calibrator and reference control respectively. Data collected from 3 independent experiments is represented as mean fold change ± SD. B – Schematic alignment of miR-142a-3p MO with pre-miR-142a. Mature miR-142a-3p sequence is in red color. C - Relative quantification of mature miR-142a-3p in non-injected control (NIC) and embryos injected with 200 µM miR-142a-3p MOs at 2 dpf. The assay was performed as described by manufacturer (QuantiMir kit, SBI, USA). The relative expression of miR-142a-3p was normalized to miR-26a. Data collected from 3 independent experiments is represented as mean fold change ± SD. D - G - Representative image of 28–30 hpf Tg(fli1:EGFP, gata1a: dsRed) zebrafish embryos. Inset displaying intersegmental vessels from non-injected control and 200 μM miR-142a-3p morpholino injected embryos. Images are arranged in a lateral view and inset displaying 11–15 intersegmental vessels from the trunk region. The images are taken at 5× and 10× magnifications. Arrowheads indicate regions with vascular defects. H - Bar graph showing embryos with inter-segmental vessel defects in non-injected control (NIC) and 200 μM miR-142a-3p morpholino injected embryos at 28–30 hpf. PHENOTYPE:
|
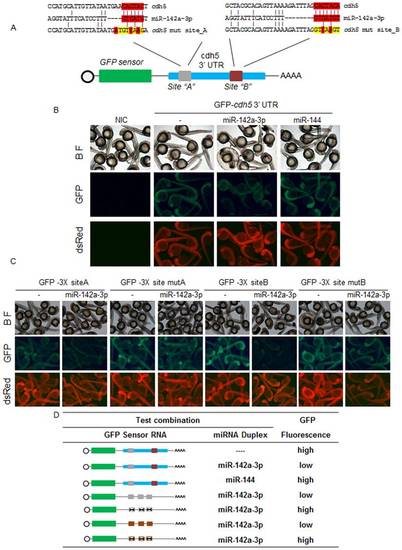
In zebrafish, miR-142a-3p regulates cdh5 via its two predicted binding sites. A - Schematic of GFP-cdh5 3′UTR transcript containing two miR-142a-3p predicted binding site (site “A”, grey; site “B”, brown). Predicted miRNA seed sequences binding sites are enlarged and boxed in red. Selected nucleotides were mutated in the seed region for destroying miR-142a-3p binding site is displayed in yellow color. B and C - Silencing effect of miR-142a-3p on the series of sensor mRNA encoding GFP fused to various test 3′UTRs (as tabulated in panel D). B - Co-injection of the miR-142a-3p and GFP-cdh5 32UTR mRNA leads to suppression of GFP expression in wildtype zebrafish embryos. C – Co-injection of miR-142a-3p with various test combinations of GFP sensor fused to the miR-142a-3p seed sequence binding sites, engineered in triplicates. Strong miR-142a-3p induced suppression of GFP expression was observed with both the predicted binding sites (GFP-32UTR3X site A and GFP-32UTR3X site B). However, suppression was relieved on mutating the binding sites (GFP-32UTR3X mut site A and GFP-32UTR3X mut site B). Bright-field image of embryos are shown in the upper row of each panel. DsRed mRNA was co-injected with the test transcripts as a control and is shown in the lower row of each panel. In the middle row of each panel various GFP-32UTR sensor RNA and miRNA combinations were tested as labeled. Expressions of the reporters were analyzed at 26 to 28 hours post fertilization. Group images of embryos that were co-injected of various GFP- 32UTR mRNA and miR-142a-3p are compared with embryos receiving respective GFP-3′ UTR sensor only. Clutch of representative embryos (7–9 embryos in each image) were photographed together in a single image to ensure valid comparison of relative green fluorescent intensity between two groups. The images are taken at 2.5× magnification. D - Various combinations of GFP sensor and miRNA were tested and scored using a comparative scale for GFP intensity and are represented either as high or low. The colour schemes of the cdh5 3′ UTR variants follow those mentioned in Figure 6A. The black “X” indicates a mutated miR-142a-3p site. The bioactivity of GFP-Sensor with 4X miR-142a-3p perfect complimentary target (PT) sites and miRNA duplex is shown in Supplementary Figure S5. |
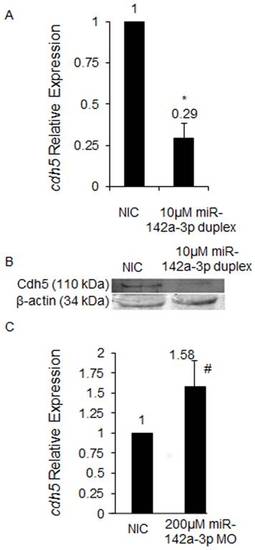
In zebrafish, miR-142a-3p regulates cdh5. A - cdh5 relative expression quantified by QRT–PCR upon overexpression of miR-142a-3p. Total RNA was isolated from 2 dpf non-injected control (NIC) and 10 μM miR-142a-3p duplex injected Tg(fli1:EGFP, gata1a: dsRed) zebrafish embryos. 2 μg of total RNA was used for preparing cDNA. Beta-actin was used as an internal control. Data collected from 4 independent experiments is represented as mean fold change ± SD. Asterisk (*) indicates p value of 0.001 as determined by 2-tailed t-test. B - Western Blot analysis for Cdh5 protein in zebrafish embryos using previously tested antibody directed against human VE-cad (110 kDa) [13] in non-injected control (NIC) and 10 μM miR-142a-3p duplex injected 2 dpf zebrafish embryos. Beta-actin was used as a loading control. C - cdh5 relative expression quantified by QRT–PCR upon downregulation of miR-142a-3p. Total RNA was isolated from 3 dpf non-injected control (NIC) and 200 μM miR-142a-3p MO injected Tg(fli1:EGFP, gata1a: dsRed) zebrafish embryos. 2 ug of total RNA was used for preparing cDNA. Beta-actin was used as an internal control. Data collected from 4 independent experiments is represented as mean fold change ± SD. Hash (#) indicates p value of 0.03 as determined by 2-tailed t-test. EXPRESSION / LABELING:
|
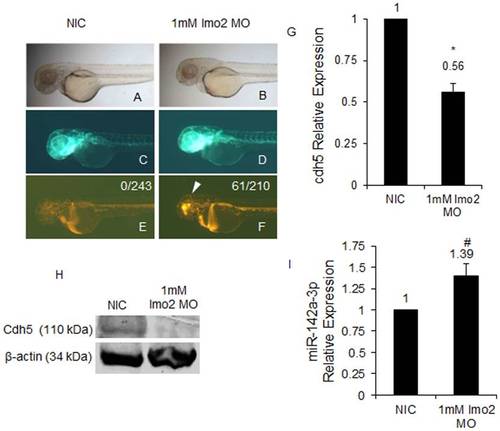
miR-142a-3p and Cdh5 are regulated by the transcription factor Lmo2 in zebrafish. A–F - Morpholino (MO) mediated Lmo2 knockdown induces cerebral hemorrhage phenotype in 2 dpf Tg(fli1:EGFP, gata1a: dsRed) zebrafish embryos. A,C,E - non-injected control (NIC) and B,D,F - 1 mM lmo2 MO injected zebrafish embryos. The embryos were imaged at 2.5× magnification. Arrowheads indicate the site of hemorrhage. G - cdh5 relative expression quantified by QRT–PCR in lmo2 knockdown Tg(fli1:EGFP, gata1a: dsRed) zebrafish embryos. Data collected from 4 independent experiments is represented as mean fold change ± SD. Asterisk (*) indicates p value of 0.0001 as determined by 2-tailed t-test. H - Western Blot analysis for Cdh5 in 2 dpf NIC and 1 mM lmo2 MO injected zebrafish embryos. Beta-actin was used as a loading control. I - miR-142a-3p relative expression quantified by QRT–PCR in Lmo2 knockdown zebrafish embryos. The assay was performed as described by manufacturer (QuantiMir kit, SBI, USA). The relative expression of miR-142a-3p was normalized to miR-26a. Data collected from 4 independent experiments is represented as mean fold change ± SD. Hash (#) indicates p value of 0.001 as determined by 2-tailed t-test. |
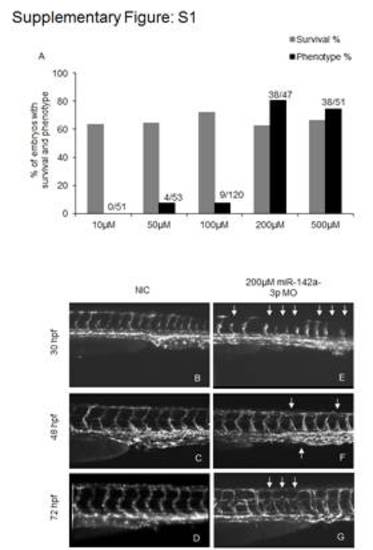
Microinjection of miR-142a-3p morpholino (MO) in zebrafish embryos in Tg(fli1:EGFP, gata1a: dsRed) leads to intersegmental vessel (Se) remodeling. A - Graphical representation of dose dependent microinjection ranging from 10–500 μM of miR-142a-3p morpholino (MO) in 28–30 hpf Tg(fli1:EGFP, gata1a: dsRed) zebrafish embryos. Bar graph showing percentage of embryos with survival (grey) and intersegmental vessel (Se) defect (black). Numbers of embryos analyzed are indicated in parenthesis. B–G Representative image of Tg(fli1:EGFP, gata1a: dsRed) zebrafish embryos displaying intersegmental vessels (Se) from non-injected control and 200 μM miR-142a-3p morpholino injected embryos at different developmental stages. Images are arranged in a lateral view and displaying intersegmental vessels (Se) from the trunk region. Arrowheads indicate regions with vascular defects. |
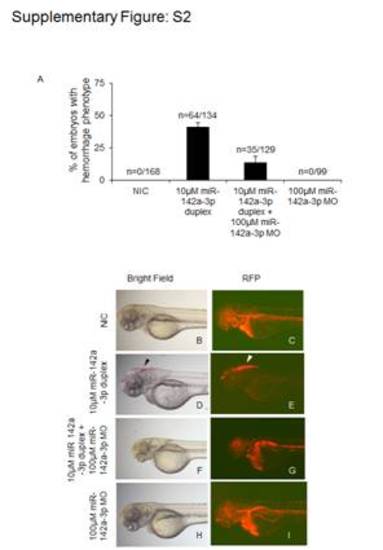
Rescue of miR-142a-3p duplex induced hemorrhage phenotype in zebrafish embryos using antisense morpholino targeting to the mature form of miR-142a-3p. A - Bar graph showing cerebral hemorrhage phenotype in non-injected control (NIC); 10 μM miR-142a-3p duplex injected; co-injection of 10 μM miR-142a-3p duplex with 100 μM miR-142a-3p morpholino (MO); and 100 μM miR-142a-3p MO injected Tg(fli1:EGFP, gata1a: dsRed) zebrafish embryos at 2dpf. Data is represented as mean percentage ± SD (standard deviation) collected over 3 independent experiments. n represents the number embryos analyzed. B-I - Representative images of cerebral hemorrhage phenotype in Tg(fli1:EGFP, gata1a: dsRed) zebrafish embryos at 2 dpf. B and C - NIC embryos. D and E - 10 μM miR-142a-3p duplex injected embryos. F and G – Embryos receiving co-injection of 10 μM miR-142a-3p duplex with 100 μM miR-142a-3p MO. H and I - 100 μM miR-142a-3p MO injected embryos. The embryos were imaged at 2.5× magnification. Arrowheads indicate the site of hemorrhage. |
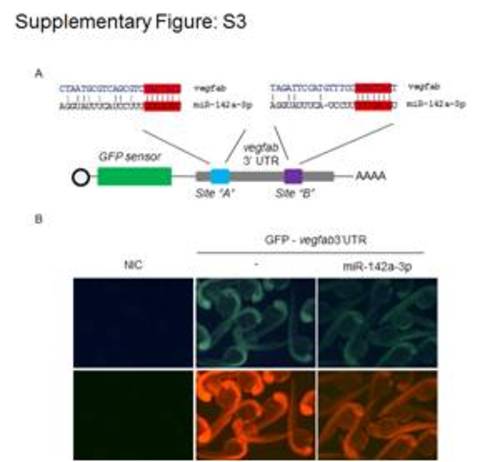
GFP sensor target validation assay for vegfab 3′UTR. A - Schematic of GFP-vegabf 3′UTR transcript containing two miR-142a-3p predicted binding site (site “A”, blue; site “B”, purple). Predicted seed complementarity sequences are boxed in red colour. B - Silencing effect of miR-142a-3p on the GFP-vegfab 32UTR gene target. Co-injection of the GFP-vegfab 3′UTR mRNA and miR-142a-3p led to moderate suppression of GFP expression in wildtype zebrafish embryos. Expressions of the reporters were analyzed at 26 to 28 hours post fertilization. DsRed mRNA was used as injection controls and is shown in the lower panel. Upper panel displays GFP-vegfab 3′UTR sensor RNA and miR-142a-3p combinations. Group images of embryos that were co-injected of various GFP-vegfab 3′UTR mRNA and miR-142a-3p are compared with embryos receiving respective GFP-vegfab 3′UTR sensor only. Clutch of representative embryos (7–9 embryos in each image) were photographed together in a single image to ensure valid comparison of relative green fluorescent intensity between two groups. The embryos were imaged at 2.5× magnification. |
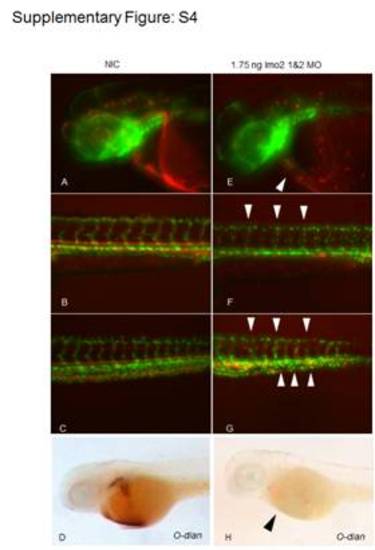
Microinjection of lmo2 1&2 morpholino (MO) in Tg(fli1:EGFP, gata1a: dsRed) zebrafish embryos. A-H - Morpholino (MO) mediated Lmo2 knockdown induces blood cells and blood vessel defects in 2 dpf Tg(fli1:EGFP, gata1a: dsRed) zebrafish embryos. A–D - non-injected control (NIC) and E – H 1.75 ng lmo2 1&2 MO injected zebrafish embryos. A–C, E – G Apotome microscope images (GFP/RFP merged) of lmo2 1&2 MO injected Tg(fli1:EGFP, gata1a: dsRed) embryos at 2 dpf (Lateral View). A–C - non-injected control embryos and E – G –lmo2 1&2 MO injected embryos. D, H - Embryos stained with o-dianisidine. The embryos were imaged at 10× magnification (A–C, E–G) and 2.5× magnification (D, H). Arrowheads indicate the site of defects. PHENOTYPE:
|
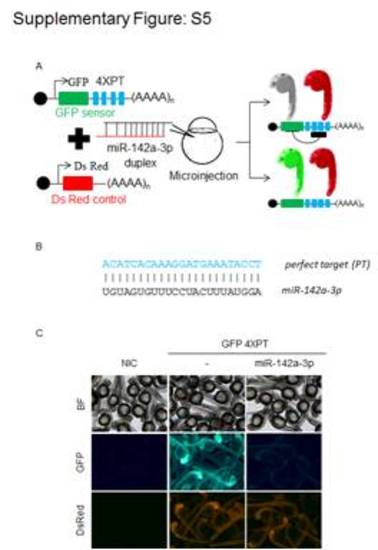
Bioactivity of GFP sensor with 4× miR-142a-3p perfect complimentary target (PT) sites and miRNA duplex. A - Schematic of miRNA target validation GFP sensor assay. B - Schematic of miR-142a-3p perfect target (PT) sequence complementary with miR-142a-3p sequence. C - Silencing effect of miR-142a-3p on the GFP-4X PT 3′UTR gene target. Co-injection of the miR-142a-3p and GFP-4X PT 3′UTR mRNA led to suppression of GFP expression in wildtype zebrafish embryos. Expressions of the reporters were analyzed at 26 to 28 hours post fertilization. Bright-field image of embryos are shown in the upper row of each panel. DsRed mRNA was used as injection control and is shown in the lower row of each panel. In the middle row of each panel various GFP-4X PT 3′UTR sensor RNA and miR-142a-3p combinations were tested as labeled. Group of images in which embryos with co-injection of various GFP-4X PT 3′UTR mRNA and miR-142a-3p images are compared with embryos receiving respective GFP-4X PT 3′UTR sensor only. Clutch of representative embryos (7-9 embryos in each image) were photographed together in a single image to ensure valid comparison of relative green fluorescent intensity between two groups. The embryos were imaged at 2.5× magnification. |