
- Title
-
Yolk syncytial layer formation is a failure of cytokinesis mediated by Rock1 function in the early zebrafish embryo
- Authors
- Chu, L.T., Fong, S.H., Kondrychyn, I., Loh, S.L., Ye, Z., and Korzh, V.
- Source
- Full text @ Biol. Open

Dynamics of yolk cortical microtubules and marginal blastomere boundaries during YSL formation. Whole-mount embryos were stained for β-tubulin (green), F-actin (red) and DNA (blue). All images are projections of multiple focal planes. Insets show higher magnifications of boxed areas in the respective panels. (A) The furrow microtubule array (FMA) between blastomeres (Aiii, arrowhead) is apparent at the 32-cell stage. (B) YCL microtubules of the marginal blastomeres at 128-cell stage. (C) 256-cell stage microtubule arrays extend into the YCL (Ciii inset, curly bracket). Arrowheads in Ai–Ci indicate prominent lower borders between marginal blastomeres. (D) Marginal blastomeres flattened at the 512-cell stage; some have lost cell borders (Di, arrow) while others are still present (Di, arrowheads). Arrow in Diii inset indicates a cell in interphase; arrowhead indicates a mitotic cell. (E) At 1k-cell stage, some marginal cell borders remain (Ei, arrowheads). Arrowheads in Eii indicate large interdigitating aster-like microtubule arrays. (F) At oblong stage, YSN have multiplied and spread vegetally (Fi, arrowhead). Dashed circle in Fiii highlights the microtubule arrays radiating from a vegetal YSN. |
|
In vivo membrane dynamics at the blastoderm edge during YSL formation during normal development. Selected frames from supplementary material Movie 1 showing the sequence of events during YSL formation. The prominent cell membrane of a marginal blastomere is obvious at the 512-cell stage (arrowhead in A). Note the absence of membrane between daughter nuclei as the cells divide to give rise to a 1k-cell stage embryo (white arrow in G–N). Note a pre-existing membrane at the margin regressing as the YSL develops (red arrowhead in M–R). Nuclei are unstained and appear as dark circles. |
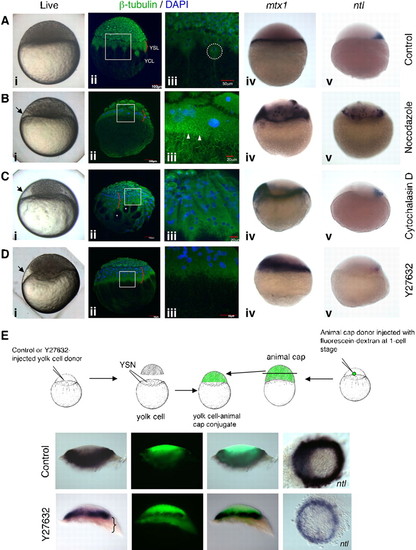
Disruption of cytoskeletal elements induces formation of enlarged YSL. (A) Control, (B) nocodazole-treated, (C) cytochalasin D-treated, and (D) Y27632-injected embryos between oblong to sphere stages. Arrows in Bi–Di indicate enlarged YSL. Curly brackets in Aii–Dii indicate the width of the YSL microtubule belt. (Aiii–Diii) High magnification images of boxes in Aii–Dii respectively. (Aii,Aiii) Microtubule distribution in a control embryo. A large aster in the YSL (stippled circle, Aiii). (Bii,Biii) Disorganized microtubules in the YSL and YCL, with small asters in the enlarged YSL (arrowheads, Biii). (Cii,Ciii) Gaps in the YCL (Ciii, asterisks). (Dii,Diii) Dense YSL and sparse YCL microtubule arrays. The enlarged syncytia express mtx1 (Biv–Div), and induces ntl in the overlying blastoderm (Bv–Dv). (E) Mesoderm induction assay. The enlarged syncytium (curly bracket) induced ntl in the fluorescein-labelled animal cap. |
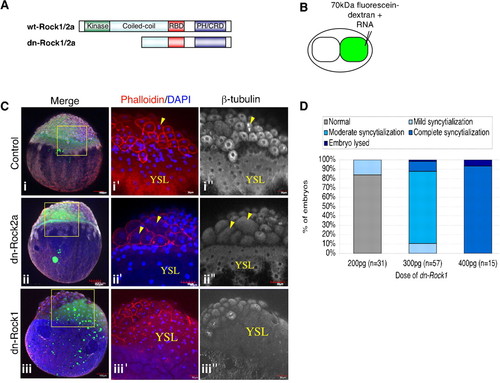
Rock1, but not Rock2a, is necessary for YSL formation in the zebrafish embryo.> (A) Protein domains of Rock1 and Rock2a and the putative dominant-negative (dn) construct. (B) Schematic of single-cell injection into the 2-cell stage embryo. (C) Embryos at oblong stage were stained for β-tubulin (white), F-actin (red) and DNA (blue). Images are projections of multiple focal planes. Arrowheads in Ci′,i′′ indicate a mitotic cell in late anaphase. Injection of dn-Rock2a (Cii–ii′′) did not affect YSL formation. Injection of dn-Rock1 (Ciii–iii′′) caused expansion of the YSL. (D) Statistical data for embryos expressing dn-Rock1 showing dose-dependent YSL expansion. |

The cea mutant has an enlarged YSL. (A) Wild-type and (B) cea mutant embryos at 4 hpf. Arrow in B indicates the enlarged syncytial layer. (C–D′) Cryosections of wild-type and mutant embryos at 4 hpf, stained with anti-β-catenin antibody (green) and DAPI (blue). C′ and D′ show enlargements of the areas indicated by squares in C and D, respectively. Nuclei (white arrowheads) are not separated by cell membranes in both wild-type and mutant embryos. The clusters of nuclei and surrounding cytoplasm are larger in the cea mutant than the wild-type embryo (compare C′ with D′). (E,F) Whole-mount in situ hybridization of (E) control and (F) cea mutant embryos with the YSL marker, mtx1. The enlarged syncytial layer expresses mtx1 at 6 hpf. |