
- Title
-
The 3-hydroxy-3-methylglutaryl-CoA reductase (HMGCR) pathway regulates developmental cerebral-vascular stability via prenylation-dependent signalling pathway
- Authors
- Eisa-Beygi, S., Hatch, G., Noble, S., Ekker, M., and Moon, T.W.
- Source
- Full text @ Dev. Biol.
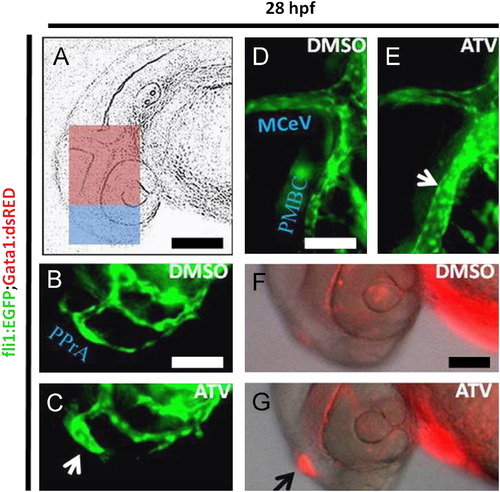
Pharmacological inhibition of the HMGCR pathway induces cerebral-vascular defects in developing zebrafish. (A) Representative schematic diagram of a 28 hpf zebrafish embryo, with the blue boxed area denoting the forebrain and the pink boxed area showing the midbrain regions. Scale bar=200 μm. ((B)–(G)) Representative photomicrographs of Tg(fli1:EGFP);(gata-1:DsRed) embryos soaked in DMSO or 0.5 mg/L ATV and imaged at 28 hpf. Abbreviations: PMBC, primordial midbrain channel; MCeV, middle cerebral vein; PPrA, primitive prosencephalic artery. White arrows indicate the abnormally dilated vessels in the forebrain and midbrain, whereas the black arrow denotes area of stagnant erythrocyte accumulation in the head. Scale bar=40 μm. |
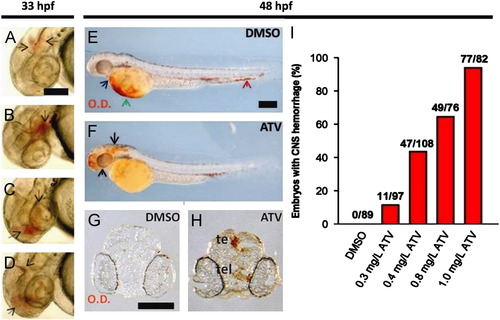
Pharmacological inhibition of the HMGCR pathway induces cerebral hemorrhage in developing zebrafish. ((A)–(D)) Photomicrographs of embryos soaked in 0.5 mg/L ATV and imaged at 33 hpf. Black arrows denote areas of hemorrhage. Scale bar=200 μm. ((E) and (F)) Bright-field images of zebrafish embryos soaked in DMSO or 0.5 mg/L ATV, stained with o-Dianisidine (OD) and imaged at 48 hpf. Black arrows indicate sites where abnormal accumulation of hemoglobinized blood was detected in the brain. The blue arrow denotes OD-positive cells in the pericardium, the green arrow shows the sinus venosus and the red arrow designates the tail region. Scale bar=200 μm. ((G) and (H)) Transverse sections through embryo heads at 48 hpf stained with OD. Abbreviations: te, tectum; tel, telencephalon. Scale bar=200 μm. (I) Percentage of embryos treated with various doses of ATV and scored for the presence of cerebral hemorrhage at 48 hpf. Numbers above the bars represent the ratios used to calculate the percentages. |
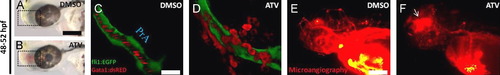
Pharmacological inhibition of the HMGCR pathway results in loss of vascular stability and induces vessel rupture. ((A) and (B)) Representative bright-field micrographs of 48–52 hpf Tg(fli1:EGFP);(gata-1:DsRed) embryos treated with DMSO or 0.5 mg/L ATV. The boxed region shows where hemorrhage is observed. Scale bar=200 μm. ((C) and (D)) Representative composite confocal Z-stack projections of the boxed regions in the same Tg(fli1:EGFP);(gata-1:DsRed) embryos. Abbreviations: PrA, prosencephalic artery. Scale bar=40 μm. ((E) and (F)) Representative photomicrographs of 48–52 hpf embryos treated with DMSO or 0.5 mg/L ATV and subjected to fluorescence microangiography by intravascular injection of red-fluorescent microspheres. The white arrow shows the site of microsphere extravasation. PHENOTYPE:
|
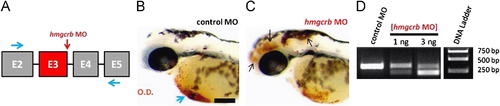
MO-mediated inhibition of the HMGCR pathway phenocopies ATV-treatment. (A) Partial hmgcrb pre-mRNA structure (not to scale) showing the exons (boxes), introns (black lines), the target of hmgcrb MO (red vertical arrow) and the positions of forward and reverse primers (black arrows) used to test the efficiency of the hmgcrb MO. ((B) and (C)) Representative bright-field micrographs of 48 hpf embryos injected with hmgcrb MO and control MO, stained with OD. Black arrows indicate sites of hemorrhage and blue arrow denotes the sinus venosus. Anterior is to the left and dorsal to the top. Scale bar=200 μm. (D) RT-PCR analysis of hmgcrb mRNA in hmgcrb morphant and control MO-injected embryos at 48 hpf. MO injection results in the dose-dependent appearance of a band corresponding to a transcript lacking exon-3. Doses of ATV are indicated above each lane. PHENOTYPE:
|
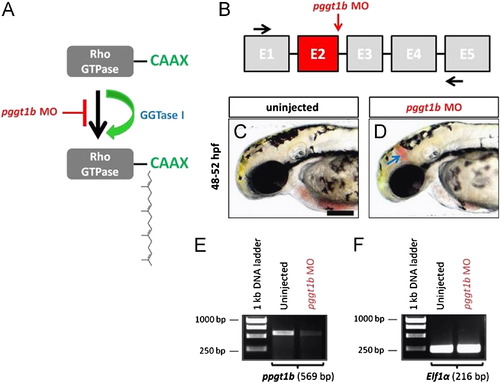
MO-mediated ablation of pggt1b mimics statin and hmgcrb MO-induced cerebral hemorrhages and effectively reduces the wild-type pggt1b mRNA. (A) Schematic representation of GGTase I-mediated transfer of a 20-carbon geranylgeranyl lipid to the cysteine residue of Rho GTPases. (B) Partial pggt1b pre-mRNA structure (not to scale) showing the exons (boxes), introns (black lines), the target of pggt1b MO (red vertical arrow) and the positions of forward and reverse primers (black arrows) used to test the efficiency of the pggt1b MO. ((C) and (D)) Representative bright-field photomicrographs of 48 hpf embryos. The blue arrow denotes the site of blood extravasation in the midbrain region of the embryo injected with pggt1b MO. Anterior is to the left and dorsal to the top. Scale bar=200 μm. (E) RT-PCR on total RNA extracted from in uninjected and MO-injected embryos at 48 hpf to assess pggt1b mRNA levels. MO injection results in the loss of wild-type pggt1b mRNA (see text for details). (F) The transcript levels of eif1a were assessed as an internal control and appeared unchanged. PHENOTYPE:
|
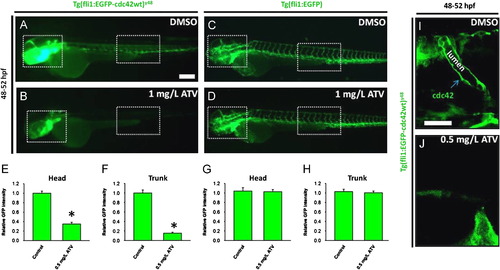
Inhibition of the HMGCR pathway abolishes the intra-endothelial expression of cdc42. ((A) and (B)) Representative photomicrographs of Tg(fli1:EGFP-cdc42wt)y48 embryos treated with DMSO or 1.0 mg/L of ATV and imaged at 48–52 hpf. ((C) and (D)) Representative photomicrographs of Tg(fli1:EGFP) embryos treated with DMSO or 1.0 mg/L of ATV and imaged at 48–52 hpf. Anterior is to the left and dorsal to the top. Scale bar=200 μm. ((E)–(H)) Graphs plotting relative EGFP signal intensities in the head and trunk vasculature (as denoted by the dotted white boxes in (A)–(D)) of (fli1:EGFP-cdc42wt)y48 and Tg(fli1:EGFP) embryos treated with DMSO or 0.5 mg/L of ATV. Data are presented as the mean and standard error of the mean. N=15 embryos, t-test, p<0.001 (for (E) and (F)). ((I) and (J)) Representative composite confocal Z-stack projections of the trunk region of Tg(fli1:EGFP-cdc42wt)y48 embryos, showing the localization of EGFP-cdc42 in a single intersegmental artery (ISV). The green arrow denotes perivacuolar expression of EGFP-cdc42. Scale bar=40 μm. Anterior is to the left and dorsal to the top. EXPRESSION / LABELING:
|
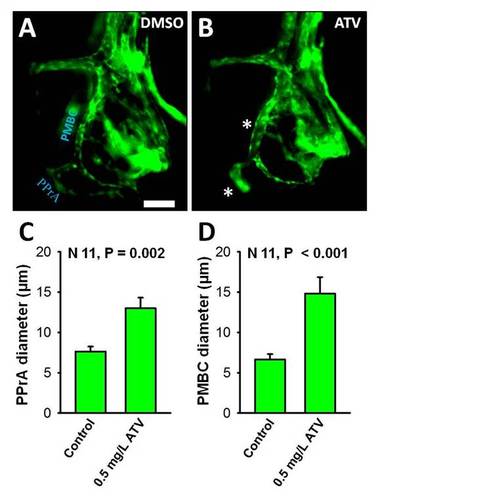
Inhibition of HMGCR is associated with clusters of abnormally dilated cerebral vessels in the forebrain and hindbrain. (A, B) Representative photomicrographs of Tg(fli1:EGFP) embryos exposed to DMSO or 0.5 mg/L ATV and imaged at 28 hpf. White asterisks indicate abnormally dilated PPrA and PMBC. Anterior is to the left and dorsal to the top. Scale bar = 40 μm. (C, D) 2D quantification of 28 hpf zebrafish cerebral vessel diameters. Data are presented as the mean and standard error of the mean. N = 11, p = 0.002 (C) and p < 0.001 (D). |
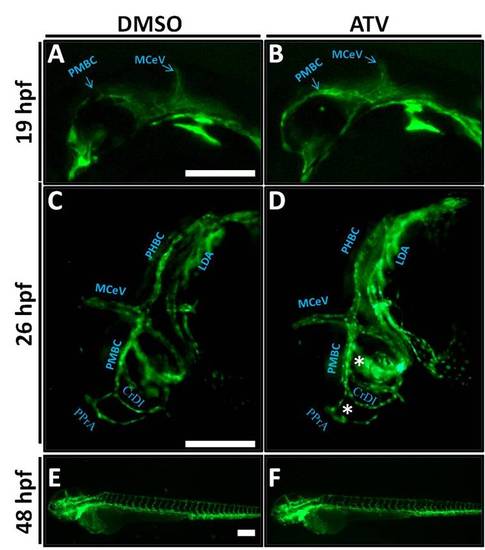
Embryos with cerebral hemorrhage have normal vascular patterning and no regression. (A-F) Representative photomicrographs of Tg(fli1:EGFP) embryos exposed to DMSO or 0.5 mg/L ATV and imaged at 14 hpf (A, B), 26 hpf (C, D) and 48 hpf (E, F). White asterisks indicate abnormally dilated PPrA and PMBC. Anterior is to the left and dorsal to the top. Scale bars = 200 μm. PHENOTYPE:
|
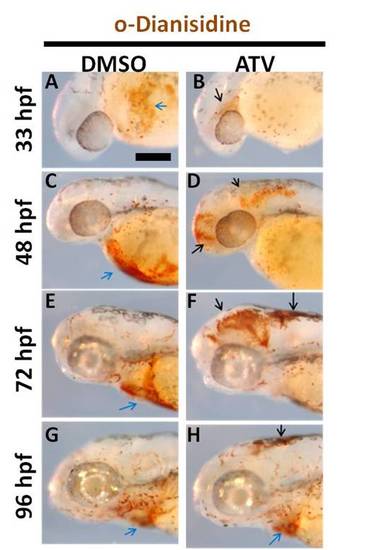
Embryos resolve cerebral-vascular defects and resume normal development. (A-H) Representative bright-field photomicrographs of zebrafish embryos soaked in DMSO or 0.5 mg/L ATV and stained with OD at various developmental stages. Black arrows indicate areas of hemorrhage and blue arrows indicate sinus venosus. Anterior is to the left and dorsal to the top. Scale bar = 200 μm. |

Unillustrated author statements PHENOTYPE:
|
Reprinted from Developmental Biology, 373(2), Eisa-Beygi, S., Hatch, G., Noble, S., Ekker, M., and Moon, T.W., The 3-hydroxy-3-methylglutaryl-CoA reductase (HMGCR) pathway regulates developmental cerebral-vascular stability via prenylation-dependent signalling pathway, 258-266, Copyright (2013) with permission from Elsevier. Full text @ Dev. Biol.