
- Title
-
Reciprocal Regulation between Resting Microglial Dynamics and Neuronal Activity In Vivo
- Authors
- Li, Y., Du, X.F., Liu, C.S., Wen, Z.L., and Du, J.L.
- Source
- Full text @ Dev. Cell

Resting Microglia Contact Neuronal Soma via Bulbous Endings(A) Overlay of two projected images of a resting microglia acquired at 0 (green) and 55 min (magenta) during in vivo time-lapse confocal imaging of optic tectum in a 6-dpf Tg(Apo-E:eGFP) zebrafish larva. Arrows and arrowheads indicate bulbous endings and stick-like endings, respectively.(B) Dynamics of the process originated from a primary branch in the dashed square in (A). It is analyzed in (C).(C) Changes over time in tip diameter (black) and extension/retraction (motility) speed (blue) of microglial process shown in (B). Dashed line indicates mean diameter of tectal neuronal soma (4.6 ± 0.2 μm), and numbered arrows mark bulbous ending occurrence. Shadowed area indicates the period during which images shown in (B) were obtained. Break in the time axis represents a 1.4 min scanning pause at time point of 28.6 min.(D) Time-lapse series showing that bulbous endings contact neuronal somata (gray) in a 6-dpf Tg(Apo-E:eGFP) larva with tectal neurons visualized by OGB-AM. Yellow and red arrows indicate two tectal neurons sequentially contacted by bulbous endings originating from the same microglial process.(E) Distribution of the duration of microglial contact with neurons. Data obtained from all 113 contact events observed from seven microglial cells in five larvae.(F) Three-dimensional reconstruction of a contact between a microglial bulbous ending (green) and a tectal neuronal soma (magenta). Original image obtained from a 5-dpf Tg(Apo-E:eGFP,Mü 4380) larva.(G) Electron microscopic images of zebrafish optic tectum longitudinal section at 6 dpf. Inset 1: microglial processes (yellow) wrapping around a neuronal soma (“N”); Inset 2: a stick-like process (arrow) passing by surrounding neuronal somata. Nucleus, asterisk; inclusion body/vesicle in microglia (“M”), arrowhead.Scale bars: 10 μm in (A), 4 μm in (B), (D), and (F), and 2 μm in (G).See also Figure S1 and Movie S1. EXPRESSION / LABELING:
|
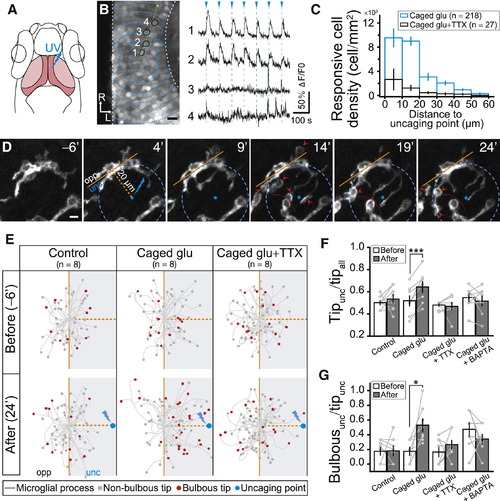
Glutamate Uncaging-Induced Local Increase of Neuronal Activity Attracts Resting Microglial Processes and Induces Bulbous Ending Formation(A) Schematic of glutamate uncaging in optic tectum of zebrafish larvae. UV uncaging pulse (blue) is delivered to 1 μm diameter region in optic tectum soma layer (dark pink). Neuropil of the optic tectum, light pink. Rostral is to up of image.(B) OGB-AM labeled optical section (left) and glutamate uncaging-induced Ca2+ responses of four example tectal neurons (black circles along the dashed yellow arrow) (right). Blue arrowheads and dashed lines indicate timing of glutamate uncaging (1.5 min interval, 65-ms duration).(C) Responsive cell density in different ring areas depicted in (B) (dashed blue circles) around the uncaging point (blue spot) under different conditions. Data summarized from eight and six individual experiments with bath application of caged glutamate (“Caged glu”, blue) or caged glutamate + TTX (“Caged glu + TTX”, black), respectively. Total neuron number exhibiting Ca2+ activity in response to glutamate uncaging in brackets.(D) Time-lapse images of microglial process movement after focal glutamate uncaging. Boundary of two microglia, dashed magenta line. Uncaging performed repetitively at 0, 5, 10, 15, and 20 min; images taken from 6 min before the uncaging with interval of 5 min. Microglia divided into uncaging (unc) and opposite sides (opp) by brown lines. Bulbous endings, red arrowheads.(E) Spatial distribution of stick-like (gray dot) and bulbous endings (red dot) 6 min before (top) and 24 min after (bottom) beginning of uncaging when larvae were incubated with normal solution (left), caged glutamate (middle), and caged glutamate + TTX (right). Data from eight microglia (each from different larvae).(F and G) Ratios of process tip number at uncaging side to all area (Tipunc/tipall, F) and bulbous tip number to all tip number at uncaging side (Bulbousunc/tipunc, G) 6 min before (open bar) and 24 min after (filled bar) the beginning of uncaging under different conditions. Data from same cells are connected by a line.Scale bars: 10 μm in (B) and 5 μm in (D). p < 0.05; p < 0.001. Error bars represent ± SEM.See also Figure S2. |
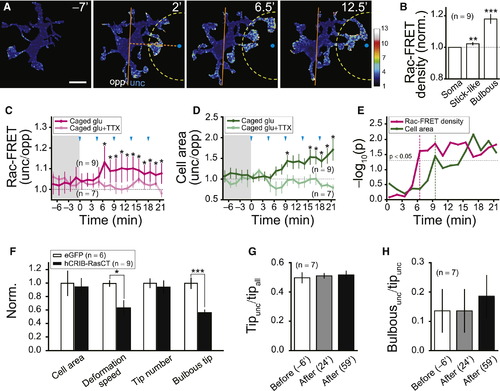
Rac Is Required for Neuronal Activity-Induced Oriented Movement and Bulbous Ending Formation of Resting Microglial Processes(A) Time-lapse images showing Rac activity subcellular distribution in a resting microglial cell expressing a Rac-FRET sensor before and after beginning of glutamate uncaging. Rac-FRET signal intensity is color-coded. Uncaging performed repetitively at 0, 4.5, 9, 13.5, and 18 min; FRET signals were imaged from 7 min before uncaging with interval of 1.5 min. Position of uncaging, blue dot. Area 20 μm around the uncaging point, truncated dashed circle. Scale bar represents 10 μm.(B) Summary of subcellular distribution of Rac-FRET signal density in resting microglial soma and processes with stick-like or bulbous ending. Data from nine microglial cells in nine larvae.(C and D) Glutamate uncaging-induced changes with time of Rac-FRET density ratio (C) or cell area ratio (D) between the uncaging (unc) and opposite sides (opp). Each data point obtained after uncaging was statistically compared with the mean control value averaged from the data before the uncaging (shadowed area). Number of microglial cells examined in brackets.(E) Time courses of log10(p value) in (C and D). Magenta and green dashed lines indicate first time points, at which these two ratios are significantly changed, respectively. Dashed horizontal line indicates 0.05 of p value.(F) Effects of hCRIB-RasCT expression on the overall microglial morphology. Data normalized to control.(G and H) Tipunc/tipall (G) and Bulbousunc/tipunc (H) 6 min before (open), 24 min (gray), and 59 min (black) after beginning of glutamate uncaging in microglia expressing hCRIB-RasCT. p < 0.05, p < 0.01, p < 0.001. Error bars represent ± SEM. |
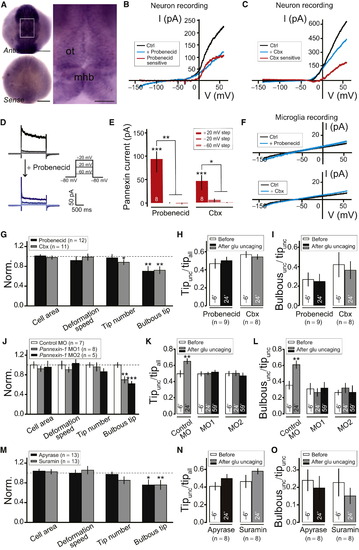
Pannexin-1 Hemichannels on Neurons and ATP/P2 Receptor Signaling Are Required for Neuronal Activity-Induced Steering and Bulbous Ending Formation of Microglial Processes(A) Dorsal view of whole-mount in situ hybridization of pannexin-1 in zebrafish embryos at 1 dpf. ot, optic tectum; mhb, midbrain-hindbrain boundary. Scale bar represents 150 µm (A); 50 µm (inset).(B and C) I-V plots of tectal neurons before (black) and after local puffing of 5 mM Probenecid (B, blue) or 500 μM Carbenoxolone (Cbx; blue in C). Red traces indicate Probenecid-sensitive (B) or Cbx-sensitive (C) currents. Voltage ramp with 500-ms duration from 140 mV to +60 mV was applied to obtain the I-V plot; cells held at 80 mV.(D) Depolarization voltage step-induced current before (top) and after (bottom) local puffing of 5 mM Probenecid against the soma of recorded tectal neuron.(E) Averaged amplitude of Probenecid- and Cbx-sensitive voltage step-evoked pannexin currents. Number of tectal neurons examined in larvae between 4–6 dpf on bar. In (D) and (E), cell was held at 80 mV and depolarized to +20 mV (dark color), 20 mV (middle color), or 60mV (light color) for 2 s.(F) I-V plots of microglia before (black) and after (blue) local puffing of 5 mM Probenecid (top) or 500 μM Cbx (bottom). Microglia recorded from Tg(Apo-E:eGFP) larvae.(G) Summary of effects of Probenecid (2.5 mM) or Cbx (50 μM) on overall morphology of resting microglia. All data normalized to control.(H and I) Tipunc/tipall (H) and Bulbousunc/tipunc (I) 6 min before, and 24 min after beginning of glutamate uncaging, when larvae were incubated in Probenecid (2.5 mM) or Cbx (50 μM).(J) Summary of effects of pannexin-1 MO1 and MO2 on overall morphology of resting microglia. All data normalized to control.(K and L) Tipunc/tipall (K) and Bulbousunc/tipunc (L) 6 min before, 24 min, and 59 min after the beginning of glutamate uncaging in larvae injected with control MO, pannexin-1 MO1 or MO2. Same data set as (J) was used.(M) Summary of effects of Apyrase (5 U/ml) or Suramin (100 μM) on overall morphology of resting microglia. All data normalized to control.(N and O) Tipunc/tipall (N) and Bulbousunc/tipunc (O) 6 min before and 24 min after beginning of glutamate uncaging, when larvae were incubated in Apyrase (5 U/ml) and Suramin (100 μM). p < 0.05; p < 0.01; p < 0.001. Error bars, ± SEM.See also Figure S4. EXPRESSION / LABELING:
|
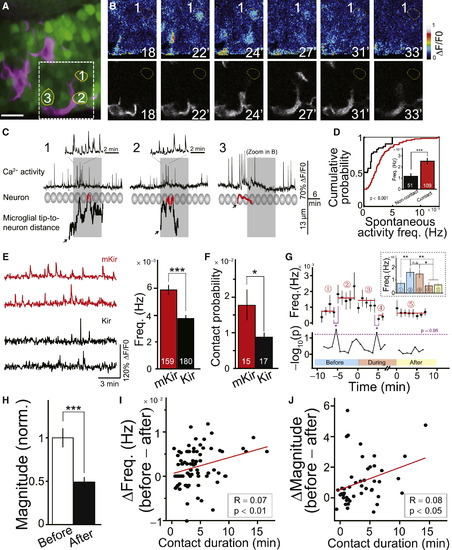
Microglia Preferentially Contact Neurons with High Levels of Spontaneous Activity(A) Confocal image showing microglia (magenta) and neurons (green) loaded with OGB-AM in optic tectum. Numbered neurons exhibited high spontaneous Ca2+ activity and were contacted by microglial bulbous endings during experiment. Scale bar represents 5 μm.(B) Time-lapse images of the squared area shown in (A). Simultaneous imaging of neuronal activity (top) and microglial morphology (bottom). Occurrence of microglial contact with this neuron in red circle.(C) Temporal relationship between spontaneous Ca2+ activities (top) in the numbered neurons in (A) and (B) and occurrence of microglial contacts with those neurons (bottom). Shadowed ovals show position and size of the neurons. Traces (bottom) show dynamic changes in distance between neuron and corresponding microglial process tip. Red parts highlight occurrence of bulbous contact. Black arrows mark initiation point of processes from microglial primary branches or soma. Grey shadowed areas mark the period of images shown in (B).(D) Cumulative distribution of spontaneous Ca2+ activity frequency in microglia-contacted (Contact) and noncontacted neurons (Non-contact). Data obtained from 5 zebrafish larvae. Inset: averaged results. Number of neurons examined on bars.(E) Spontaneous Ca2+ activities in mKir- (red) and Kir- (black) expressing tectal neurons. Left: example traces. Right: summary of Ca2+ activity frequency.(F) Probability of contact between microglial processes and tectal neurons expressing mKir or Kir channels. Number of 6-dpf larvae examined on bars.(G) Time course of spontaneous Ca2+ activity frequency (top) and corresponding -log10(p value) (bottom) before (Periods 1 and 2), during (Periods 3 and 4), and after (Period 5) microglial contacts. Red lines represent average values for corresponding periods. Dashed line (bottom) indicates 0.05 of p value. Data obtained from 52 neurons contacted by seven microglia in five larvae. All data were aligned to time-points at which microglial contacts initiate and terminate. Inset: summary data.(H) Summary of total charge (Magnitude) of mean spontaneous Ca2+ transients within 6 min before and within 7 min after the microglial contact.(I and J) Correlation between decrease in the frequency (I) or magnitude (J) of spontaneous Ca2+ transients with duration of microglia-neuron contact. Red lines show linear regression fits (Spearman correlation analysis). n.s., no significance; p < 0.05; p < 0.01, p < 0.001. Spearman correlation analysis in (I) and (J). Error bars represent ± SEM.See also Figure S3. |
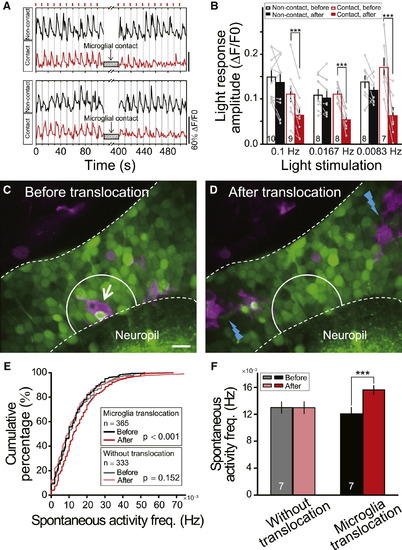
Microglial Contact Reduces Visually Evoked Responses of Tectal Neurons(A) Examples of repeated moving bar-evoked Ca2+ activities of tectal neurons contacted (Contact, red) or not contacted (Non-contact, black) by microglial bulbous endings. Short red bars (top) indicate the moving bar stimuli applied at 0.1 Hz.(B) Summary of light responses in tectal neurons evoked by moving bars with frequencies of 0.1 Hz, 0.0167 Hz, and 0.0083 Hz. Data after microglial contacts (red filled bars) in three sets of experiments were obtained during 0–100, 0–360, and 0–480 s after the contact, respectively. Numbers of tectal neurons examined on bar. Each microglia-contacted neuron was from an individual larva, and at least one neuron without microglial contacts was examined simultaneously.(C and D) Position of one microglial cell (arrow in C) before and after two-photon laser-induced local injury in nearby regions (blue lightning in D). Images from one optical section in optic tectum of Tg(Coronin1a:DsRed) larva loaded with OGB-AM. Area between white dashed lines, optic tectum soma layer. Scale bar represents 10 μm.(E) Cumulative distribution of spontaneous Ca2+ activity frequency of neurons in truncated white circles (20 μm diameter) in (C) and (D) before and after laser-induced injury, which led to translocation (7 out of 14 larvae) or no translocation (7 out of 14 larvae) of microglia examined. Numbers of neurons examined in boxes.(F) Summary data showing spontaneous Ca2+ activity frequency in microglial pre-existing area before and after microglial translocation. Numbers of larvae examined on bars. p < 0.001. Error bars represent ± SEM.See also Figure S5. |
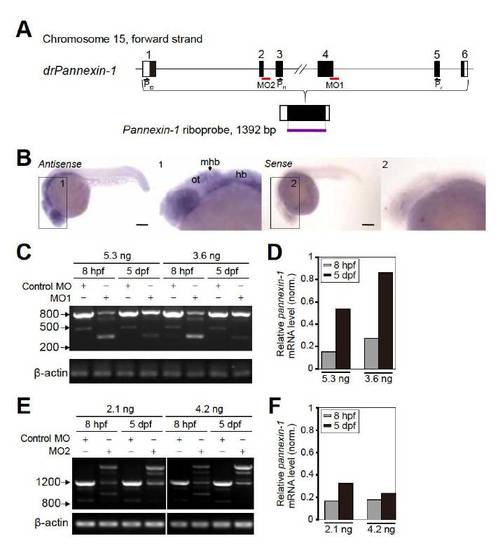
Expression Pattern of Pannexin-1 in Larval Zebrafish and the Knockdown Efficiency of Pannexin-1 Splice Morpholinos (A) Schematic of zebrafish pannexin-1 loci, including the exon (numbered boxed regions) and intron structures. Within each exon, nucleotides contributing to the presumed protein sequence are shaded. The entire coding region of pannexin-1 was used to generate digoxygenin-labeled sense and antisense riboprobes. Positions of splice sites targeted by pannexin-1 splice morpholinos (MO1 and MO2, red line) and RT-PCR primers (Pf1, Pf2 and Pr) are shown. (B) Lateral view of whole-mount in situ hybridization of pannexin-1 in zebrafish embryos at 1 dpf, showing widely expression of pannexin-1 in larval zebrafish brain, including the optic tectum. Sense control probe shows low levels of background staining. The brain region was enlarged in the inset 1 and 2 for antisense- and sense-stained embryo, respectively. The images were obtained from the same embryos shown in Figure 4A. ot, optic tectum; hb, hindbrain; mhb, midbrain-hindbrain boundary. Scale: 150 μm. (C-F) Knockdown efficiency of pannexin-1 MO1 (C and D) and MO2 (E and F). RT-PCR analysis of the pannexin-1 mRNA region flanking the targeted splice site was performed in control and pannexin-1 MO-injected embryos at 8 hpf and 5 dpf. The mRNA regions flanking MO1- (C) and MO2-targeted splice sites (E) were amplified by primer pair of Pf1/Pr and Pf2/Pr, respectively. The amount of wild-type RT-PCR products (830 bp band in C for MO1 and 1233 bp band in E for MO2) were reduced in pannexin-1 morphants compared with control embryos, and either shorter or longer splice-mutant amplification products were observed in pannexin-1 morphants. The knockdown efficiency exhibits dose-dependency for both MO1 (D) and MO2 (F). The amounts of mRNA in pannexin-1 morphants were normalized to those in control embryos. β-actin was used as an internal control. |
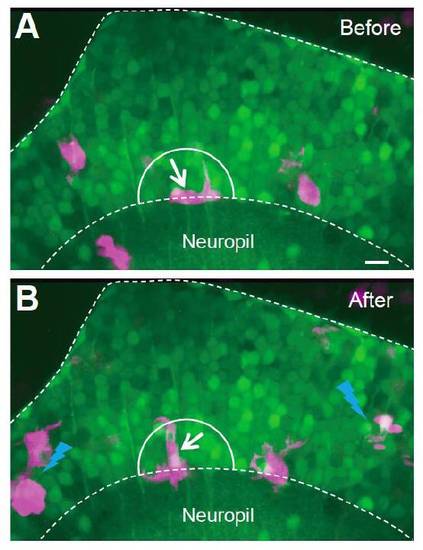
Some Microglial Cells Do Not Respond to Two-Photon Laser-Induced Local Injury Images showing that the position of one microglial cell (white arrow) was not much changed before (A) and after (B) two-photon laser-induced local injury in nearby regions (blue lightning symbols in B). The images were taken from the optic tectum of a Tg(Coronin1a:DsRed) larva loaded with OGB-AM. Scale: 10 μm. |
Reprinted from Developmental Cell, 23(6), Li, Y., Du, X.F., Liu, C.S., Wen, Z.L., and Du, J.L., Reciprocal Regulation between Resting Microglial Dynamics and Neuronal Activity In Vivo, 1189-1202, Copyright (2012) with permission from Elsevier. Full text @ Dev. Cell