
- Title
-
The Zebrafish Homologue of the Human DYT1 Dystonia Gene Is Widely Expressed in CNS Neurons but Non-Essential for Early Motor System Development
- Authors
- Sager, J.J., Torres, G.E., and Burton, E.A.
- Source
- Full text @ PLoS One
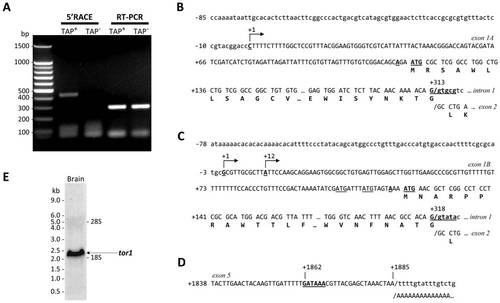
tor1 promoters and transcripts. A: Zebrafish brain total RNA was treated with tobacco acid pyrophosphatase (TAP+; lanes 2 and 4) or untreated (TAP; lanes 3 and 5) prior to RACE adapter ligation and reverse transcription. tor1 was amplified by 5′RACE using a tor1 exon 2 reverse primer and a RACE adapter primer (lanes 2 and 3) or by RT-PCR using tor1 primers (lanes 4 and 5). B, C: The transcriptional start sites of tor1_tv1 (B) and tor1_tv2 (C) were determined by comparing the genomic sequence with sequences of the 5′ RACE products shown in panel A. The transcriptional start sites are shown underlined with arrows; bases are numbered such that +1 represents the first nucleotide of the most 5′ transcriptional start site. The open reading frames of exons 1A and 1B and their 3′ splice sites are shown. The consensus ANNAUG< translational initiation signals are indicated in bold and underlined; non-consensus AUG sequences in the 5′UTR of tor1_tv2 are underlined. D: 3′RACE was employed to determine the 3′ terminus of the transcript. The polyadenylation signal within exon 5 is underlined in bold. The position of the poly(A) tail in the mRNA is indicated. E: Brain total RNA was separated electrophoretically and the resulting northern blot was probed using a cRNA probe to tor1. The positions of molecular size standards and the 28S and 18S rRNA bands are shown. |
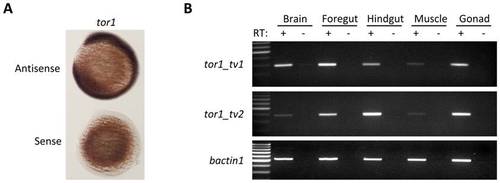
tor1 is expressed ubiquitously. A: RNA in situ hybridization was employed to detect the tor1 transcript during development. Hybridized probe was detected using a histochemical reaction with a blue/purple product. The photomicrograph shows embryos at 12 hpf; the upper of the pair was hybridized with a tor1 antisense probe and the lower with a tor1 sense control probe. B: Reverse transcriptase PCR was employed to detect tor1_tv1 (upper panel) or tor1_tv2 (middle panel) mRNA in brain, foregut, hindgut, muscle, and gonads of adult zebrafish. Total RNA was treated with reverse transcriptase (RT+); controls lacking reverse transcriptase (RT-) excluded amplification of genomic DNA sequences. bactin1 was amplified as a ubiquitously expressed control mRNA (lower panel). EXPRESSION / LABELING:
|
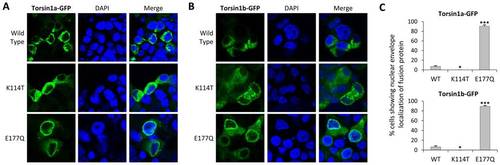
ATP-binding and ATP-hydrolysis mutations in Torsin1 alter cellular localization. MN9D cells were transfected with expression plasmids encoding either (A) Torsin1a-eGFP or (B) Torsin1b-eGFP fusion proteins. The images show single confocal planes through transfected cells demonstrating GFP fusion protein localization (green, left column) relative to the nucleus (DAPI counterstain, blue, center column). For each panel, the top row of images shows wild type Torsin1, the middle row of images shows a Torsin1[K114T] mutant, which disrupts the Walker A (ATP-binding) domain, and the bottom row shows a Torsin1[E177Q] mutant, which disrupts the Walker B (ATP hydrolysis) domain. (C) Four independent samples for each construct were evaluated for nuclear envelope localization of the fusion protein. The graphs show the mean % cells with nuclear envelope localization (100–200 cells were scored for each construct; error bars show standard error; ***P<0.0001, *p<0.05 versus WT, heteroscedastic 2-tailed T-test with Bonferroni correction). |
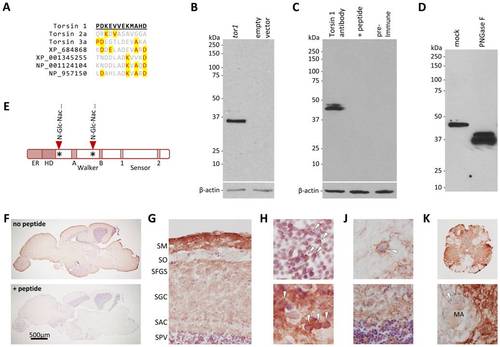
Torsin1 is a neuronal glycoprotein. A: The peptide sequence used to raise polyclonal antibodies to zebrafish Torsin1 is shown underlined in bold. An alignment between Torsin1 and the homologous regions of other zebrafish Torsin-like proteins is shown to illustrate the lack of potentially cross-reacting sequences in other Torsins. Amino acids that are identical to Torsin1 at each position are highlighted in yellow. B: HEK cells were transfected with a plasmid encoding Torsin1b (lane 1) or with empty vector (lane 2). A western blot made with lysates from transfected cells was probed with affinity-purified Torsin1 antibody. The blot was then re-probed with an antibody to β-actin as a control for equal protein loading (lower panel). C: Identical samples of zebrafish whole brain lysate were resolved by SDS-PAGE in adjacent lanes of a gel and the resulting western blot was divided into strips each containing a single lane. The strips were probed with either affinity-purified Torsin1 antibody (lane 1), affinity-purified Torsin1 antibody pre-incubated with the peptide immunogen shown in panel A (lane 2), or pre-immune serum (lane 3). The blots were then re-probed with an antibody to β-actin as a control for equal protein loading (lower panel). D: Whole brain lysate was either treated with PNGase F (lane 2) to remove N-linked carbohydrate moieties, or mock treated without addition of PNGase F (lane 1), prior to SDS-PAGE and immunoblotting with Torsin1 antibody. E: Schematic representation of Torsin1 showing the positions of the consensus N-glycosylation sites. F–K: Adult zebrafish CNS sections were labeled with Torsin1 antibody; immunoreactive structures were revealed by chromogenic histochemistry with a red reaction product. Sections were counterstained with Mayer’s hematoxylin so that nuclei appear blue. (F) Parasagittal sections of the whole zebrafish brain are shown labeled with Torsin1 antibody. In the lower panel, the antibody was pre-incubated with the peptide immunogen. (G) Optic tectum. Key: SM, stratum marginale; SO, stratum opticum; SFGS, stratum fibrosum griseum superficiale; SGC, stratum griseum centrale; SAC, stratum album central; SPV, stratum periventriculare. (H) Periventricular layer of optic tectum (upper panel) and medulla oblongata (lower image), showing cytoplasmic Torsin1 expression in neurons (arrowheads). (J) Thalamus (upper panel) and cerebellum (lower panel) showing Torsin1-related immunoreactivity in neuropil; arrowhead in upper panel shows a neuron surrounded by punctate Torsin1 immunoreactivity that may be present in nerve terminals. (K) Spinal cord at low magnification (upper panel) and high magnification (lower panel) showing robust Torsin1 immunoreactive signal in gray matter, but absence of Torsin1 in white matter. The arrowhead in the lower panel shows the myelin sheath surrounding the Mauthner axon (MA). EXPRESSION / LABELING:
|
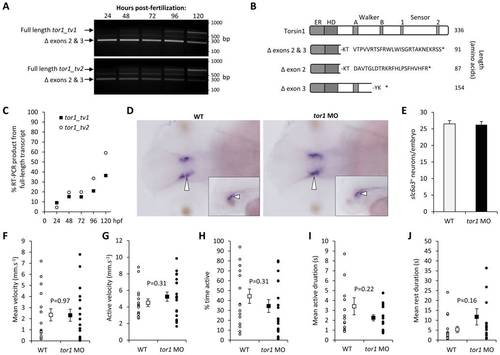
Torsin1 is non-essential for early development of the motor system. A: Single-cell zebrafish embryos were microinjected with morpholino oligonucleotides designed to block splicing of tor1 exons 2 and 3 (see figure 2). At the times indicated between 24 and 120 hours post-fertilization, RNA was harvested from developing zebrafish and subjected to RT-PCR using primers specific for tor1_tv1 (upper panel) or tor1_tv2 (lower panel). The pictures show ethidium bromide stained agarose gels after the PCR products were resolved by electrophoresis. The positions of PCR products corresponding to wild-type tor1 mRNA and the transcript lacking exons 2 and 3 are shown. B: A schematic representation is shown of the predicted protein products produced by transcripts lacking exons 2, 3 or both exons. It is not known if any of these truncated products is stable. C: The % tor1 RT-PCR product arising from the wild-type, full-length mRNA at each time point following MO injection was estimated by densitometry. D: Whole mount RNA in situ hybridization was carried out using a cRNA probe for slc6a3 (‘dat’) to localize dopaminergic neurons. Representative dorsal views are shown of the brains of an uninjected control embryo (left panel) and an embryo lacking Torsin1 (right panel) at 48 hours post-fertilization. The inset panels show representative lateral views. Developing dopaminergic neurons in the diencephalon are indicated by arrowheads. E: The total number of slc6a3+ cells in the diencephalon was counted in zebrafish lacking Torsin1 and control zebrafish at 48 hpf. Graphs show mean number of cells, error bars show standard error. F–J: Spontaneous movements of uninjected wild-type zebrafish (n = 16) and zebrafish injected with MO targeting tor1 (n = 19) were recorded at 5 dpf in 96-well plates using a video camera. Recordings were analyzed to determine: (F) mean velocity (total displacement/total time of recording); (G) active velocity (displacement/time spent moving); (H) % time active; (I) mean duration of active episodes; and (J) mean duration of rest episodes. For each graph, values for each individual larva are shown as small circles and the mean for the group shown as a filled square. Error bars shown standard error. |