
- Title
-
High resolution imaging of vascular function in zebrafish
- Authors
- Watkins, S.C., Maniar, S., Mosher, M., Roman, B.L., Tsang, M., and St Croix, C.M.
- Source
- Full text @ PLoS One
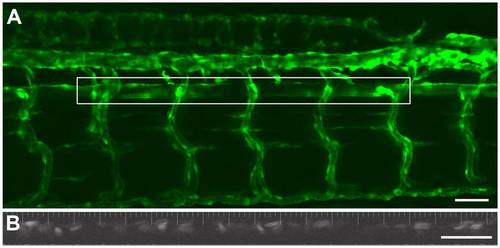
Intravital imaging of vascular dynamics in a 5 dpf zebrafish larva. An extended depth of focus projection (dorsal upwards, anterior left) of the vasculature of a Tg(kdrl:GFP)la116;Tg(gata1:dsRed)sd2 embryo with the fluorescence defining the endothelium (A). The outlined box shows the area of the aorta used for the time-based imaging of blood flow velocity and vessel diameter. The lower panel (B) shows a representative image from the same fish of the DsRed labeled erythrocytes within the dorsal aorta. This image was collected with a 2 ms exposure. With these settings it was readily possible to visualize the red blood cells flowing through the dorsal aorta over time. (Scale Bar = 100 microns). |
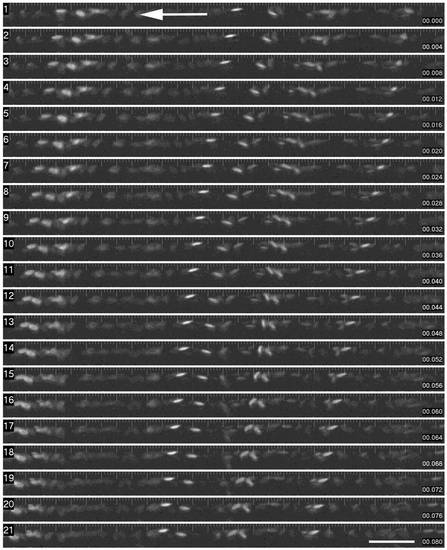
Time sequence of red blood cell flow through a segment of dorsal aorta. This montage shows individual images from a time sequence (collected every 2 ms, with a 2 ms exposure). The images shown are semi-sequential (4 ms intervals). Erythrocytes are readily visible, and the tracking of the cells from right to left can be readily seen. (Scale Bar = 100 microns). |

Image processing was performed using Imaris software (Bitplane, Saint Paul, MN). Red blood cells shown in a representative single time point (A) were segmented by size, shape, and fluorescence intensity (B) and tracked using an auto-regressive tracking algorithm (C). The frequency of image collection was set such that erythrocyte displacement is less than one cell diameter/frame and therefore individual cells can be tracked with confidence. Only cells that could be tracked for >250 µm were included in the analysis. Quantitation revealed pulsatility of blood flow in both the 3 (D) and 5 (E) dpf embryos, and confirmed our ability to measure flow velocities greater than 2 mm/s in response to the thromboxane analogue U46619 (example shown in 5 dpf embryos, panel E, open circles). |
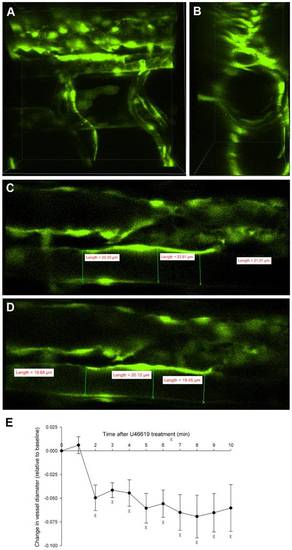
The thromboxane analogue, U-46619 decreased vessel diameter. 3D imaging of the dorsal aorta in a 5 dpf Tg(kdrl:GFP)la116 zebrafish larva with dorsal downwards and anterior right (A-D). Changes in aortic flow velocity (Figure 5) in response to U-46619 in the 5 dpf embryos, were accompanied by decreases in vessel diameter (E, n = 5, P<0.05). χ denotes statistical differences from baseline (time 0). |
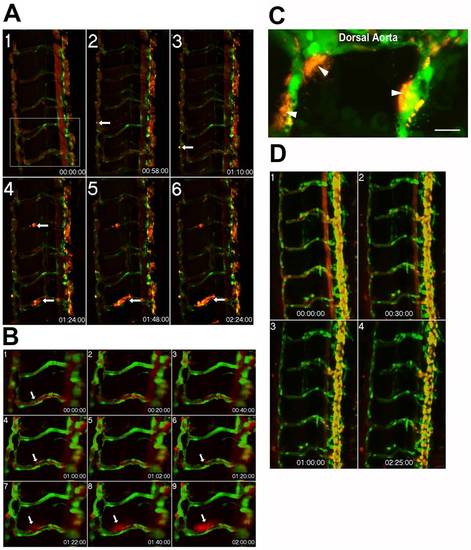
Time-lapse imaging of endothelial barrier dysfunction in response to the serine protease, thrombin. Extended depth of focus projection of the trunk vessels from a 5 dpf Tg(kdrl:GFP)la116 zebrafish larva (A). The EGFP-labeled endothelium appears green while the 0.1 μm FluoSpheres are pseudocolored red. Data were collected at baseline and at 10 minute intervals following exposure to thrombin (0.01 units/μL) for a total collection period of 3 hours. Localized increases in permeability, as evidenced by accumulation of microspheres outside the vessel wall (white arrows) were apparent by 1 h (panel 2) and increased over time (panels 3–6). The zoomed images (B) from boxed region of panel A1 show a clear break in the endothelial layer at 1 hour (panel 4). A total of 8 larvae were examined with equivalent results. These data were confirmed in a subset of larvae (n = 3) using high magnification (60X, 1.4 NA) point scanning confocal imaging and showed extensive accumulation of Fluospheres outside the vessel wall (C). In contrast, 5 dpf zebrafish larvae (n = 8) exposed to the thromboxane mimetic, U-46619 showed no evidence for disrupted barrier function (D). |
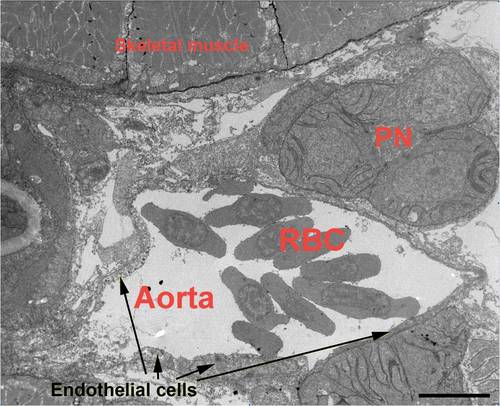
Transmission electron microscopy shows that the trunk region of the dorsal aorta of the zebrafish embryo was devoid of smooth muscle cells. This image, taken from the midpoint of the region of the aorta used for time based imaging, demonstrates that no smooth muscle cells are present around the vessel at 5 dpf. Skeletal muscle cells are clearly visible, as is the pronephros (PN). Erythrocytes (RBC) are abundant within the vessel, and endothelial cells are clearly evident. No smooth muscle cells can be detected. (Scale Bar = 20 microns). |