FIGURE SUMMARY
Title

Context-dependent proangiogenic function of bone morphogenetic protein signaling is mediated by disabled homolog 2

Authors
Kim, J.D., Kang, H., Larrivée, B., Lee, M.Y., Mettlen, M., Schmid, S.L., Roman, B.L., Qyang, Y., Eichmann, A., and Jin, S.W.
Source
Full text @ Dev. Cell

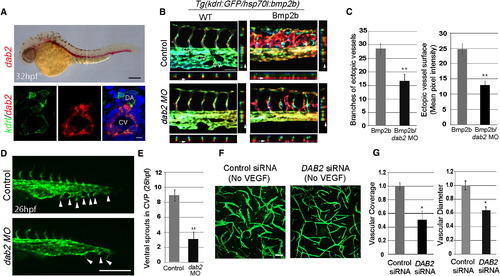
Dab2 Mediates Venous-Specific Proangiogenic Function of Bmp2b (A) Fluorescence in situ for dab2 and immunostaining for kdrl:GFP and DAPI. Lateral view (top) and transverse section (bottom). Scale bar is 200 μm (top) or 10 μm (bottom). DA, dorsal aorta; CV, cardinal vein. See also Figure S1A.(B) Depth-coded images of control or dab2 MO-injected 45 hpf wild-type (WT) and Bmp2b overexpressing (Bmp2) embryos. XZ and YZ axis views of each image are also shown. Arrows point to ectopic vessels in the projection. Images were obtained between the 16th and 20th somite. Scale bar is 100 μm. DA, dorsal aorta; DV, dorsal vein; VV, ventral vein. See also Figures S1B–S1F.(C) Quantification. The number of branches (n = 3, total number of embryos was 19 [Bmp2b] or 17 [Bmp2b/dab2 MO], p < 0.001) and vessel surface as assessed by mean GFP pixel intensity (n = 3, total number of embryos was 21 [Bmp2b] or 19 [Bmp2b/dab2 MO], p < 0.001). Error bars represent standard error of the mean (SEM).(D) Fluorescent images of 26 hpf control (top) or dab2 (bottom) MO-injected embryos. Arrowheads point to ventral sprouts. Scale bar is 100 μm.(E) Quantification of ventral sprouts in the CVP (n = 3, total number of embryos was 25 [Control] or 20 [dab2 MO], p < 0.001). Error bars represent SEM.(F) Fibrin gel assay of control and DAB2 siRNA-treated HUVECs. Scale bar is 10 μm. See also Figures S1G and S1H.(G) Quantification of vascular coverage and diameter. Values were normalized to control siRNA treatment sample by PRISM program. n = 3 and p < 0.05. Error bar is SEM.

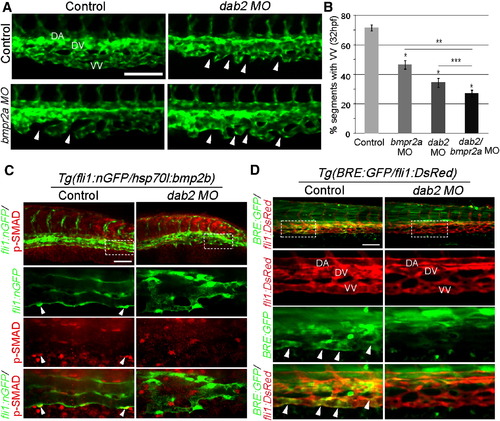
 Dab2 Functionally Interacts with Bmp2b Signal to Promote Caudal Vein Plexus Formation (A) Fluorescent images of 32 hpf control, dab2, bmpr2a, and dab2/bmpr2a MO-injected embryos. Arrowheads point to the regions that fail to connect to neighboring sprouts. Scale bar is 100 μm. See also Figure S2A.(B) Quantification of ventral vein (VV) defects. n = 3, and total number of embryos was 54 (control), 32 (bmpr2a MO), 26 (dab2 MO), or 35 (dab2/bmpr2a MO). p < 0.001 in all cases, except p value against dab2 MO-injected embryos, where p = 0.05. comparison with control MO-injected embryos; comparison with bmpr2a MO-injected embryos; and comparison with dab2 MO-injected embryos. Error bars represent SEM.(C) Confocal micrographs of control or dab2 MO-injected 45 hpf Tg(hsp70l:bmp2b) embryos, showing p-Smad-1,5/8 (red) and endothelial cells (green). Arrowheads point to p-Smad-1,5/8 within venous endothelial cells. Scale bar is 100 μm.(D) Confocal micrographs of control or dab2 MO-injected 45 hpf Tg(BRE:GFP);Tg(fli1:DsRed) embryos. Arrowheads point to GFP expression by BRE. Scale bar is 100 μm. DA, dorsal aorta; DV, dorsal vein; VV, ventral vein.

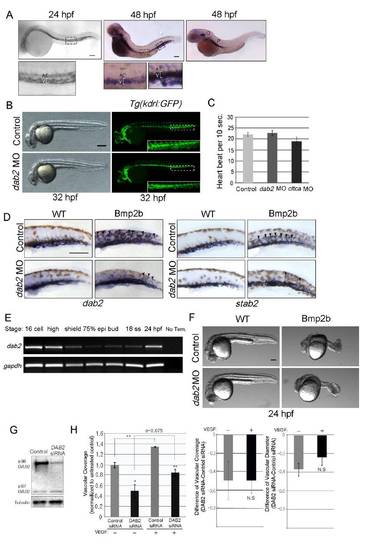
Expression pattern of dab2 in zebrafish embryo and its function in vascular development (related to Figures 1).
(A) Micrographs of 24hpf wild-type zebrafish embryos showing dab2 expression. Initially, dab2 is expressed in both arterial and venous endothelial cells. Area within rectangle is shown in higher magnification. Scale bar is 100μm. At 48hpf, dab2 is strongly expressed within the otic vesicle, pronephric duct, and venous endothelial cells. Areas within rectangles are shown in higher magnification. Scale bar is 200μm. Homozygous cloche embryos, which lack a majority of endothelial cells, only retain dab2 expression within the otic vesicle and pronephric duct (right). Abbreviations: A: aorta, O: otic vesicle, P: pronephric duct, V: vein. (B) Micrographs of control or dab2 MO injected embryos. Inhibition of Dab2 does not cause any discernible morphological defects in early stages. The most pronounced phenotypic defects were localized within the developing CVP. Areas within white rectangles are shown in a higher magnification as insets. Scale bar is 200μm. (C) Heart beats in dab2 and cltca MO injected embryos. Dab2 and Cltca deficient embryos have normal heart beat at 48hpf. (D) Micrographs of 45hpf wild-type or Tg(hsp70l:bmp2b) embryos injected with control or dab2 MO. Ectopic vessels in Bmp2b over-expressing embryos were strongly stained with venous specific marker dab2 and stab2, indicating the venous nature of these vessels. Arrows point the ectopic vessels. Scale bar is 200μm. (E) Expression of dab2 message during development measured by semi quantitative RT-PCR, demonstrating that dab2 is maternally provided. (F) Micrographs of 24hpf wild-type or Tg(hsp70l:bmp2b) embryos injected with control or dab2 MO which were heat-shocked at 10 hpf to induce over-expression of Bmp2b. Blocking Dab2 did not alleviate Bmp2b induced anterior-posterior axis defects, suggesting that Dab2 may mediate Bmp2b signaling in a stage specific manner. Scale bar is 100μm. (G) Validation of DAB2 siRNA in HUVEC. (H) Effects of DAB2 inhibition on VEGF-A mediated angiogenic responses in HUVECs. Control or DAB2 siRNA treated cells were incubated in the presence or absence of VEGF-A on Fibrin gel. Total vascular coverage and relative changes in the vascular coverage and diameter upon VEGF-A treatment in control or DAB2 siRNA-treated HUVECs were quantified by PRISM software. N=3; N.S, no significance; *p<0.05 and **p<0.005. Error bar presents standard error in the mean.

CVP formation in wild-type and dab2 deficient embryos.
(A) CVP development in dab2 MO injected embryos. In dab2 MO injected embryos, ventral sprouts from the caudal vein failed to emerge at 22hpf. Until 28hpf, the developing CVP in dab2 MO injected embryos are largely devoid of ventral sprouts. This initial defect in the formation of ventral sprouts caused dysmorphic CVP at 32hpf in dab2 MO injected embryos. Arrows present ventral sprouting of endothelial cells and arrowheads point to gaps within the CVP. Abbreviations: DA: Dorsal Aorta, DV: Dorsal Vein, VV: Ventral Vein. Scale bars are 100μm for 26hpf and 200μm for 32hpf.

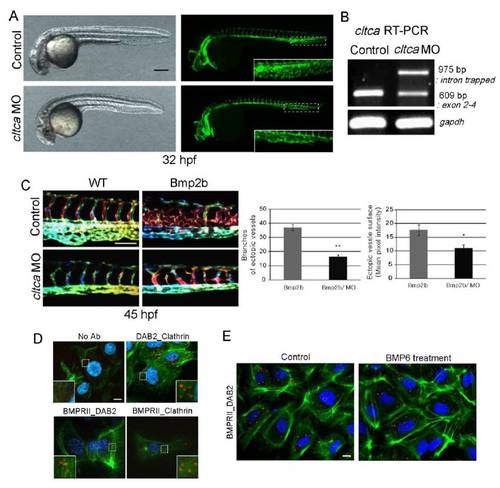
Functional relationship Clathrin with Dab2 in angiogenesis (related to Figure 3).
(A) CVP defects in cltca MO embryos. cltca MO injected embryos have multiple defects in vascular development, including severely disrupted CVP. Areas within rectangles are shown in higher magnification as insets. Scale bar is 200μm. (B) Efficacy of cltca MO was confirmed by RT-PCR. Total RNA was extracted at 48hpf to make cDNA and following primers were used for PCR reactions: Forward primer 5′-GGATCAACCCAGCCAACAT-3′, Reverse primer 5′-CTCGCACAGCGAAACAGAA-3′. (C) Blocking Cltca attenuated the extra vessel formation by Bmp2b over-expressing embryos. Scale bar is 100μm. The number of branches (N=3, total embryos=18, **p<0.001) and mean pixel intensity (N=3, total embryos=17, *p<0.01) within Bmp2b-induced ectopic vessels were drastically reduced in cltca MO injected embryos. Error bars represent standard error of the mean. (D) PLA was carried out to evaluate the co-localization of BMPRII with DAB2 and Clathrin. Scale bar is 10μm. (E) PLA to detect co-localization of DAB2 and BMPRII in the presence or absence of BMP6 (50ng/ml). Co-localization signal was not changed by presence of BMP6. Scale bar is 10μm.

Acknowledgments
This image is the copyrighted work of the attributed author or publisher, and ZFIN has permission only to display this image to its users. Additional permissions should be obtained from the applicable author or publisher of the image.

Reprinted from Developmental Cell, 23(2), Kim, J.D., Kang, H., Larrivée, B., Lee, M.Y., Mettlen, M., Schmid, S.L., Roman, B.L., Qyang, Y., Eichmann, A., and Jin, S.W., Context-dependent proangiogenic function of bone morphogenetic protein signaling is mediated by disabled homolog 2, 441-448, Copyright (2012) with permission from Elsevier. Full text @ Dev. Cell