
- Title
-
Centrosome movements in vivo correlate with specific neurite formation downstream of LIM homeodomain transcription factor activity
- Authors
- Andersen, E.F., and Halloran, M.C.
- Source
- Full text @ Development
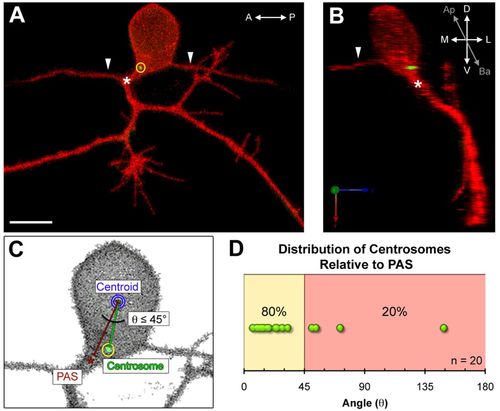
The centrosome is positioned near the peripheral axon initiation site in mature Rohon-Beard neurons. (A,B) Images of a mature Rohon-Beard (RB) neuron labeled by transient expression of TagRFP-CAAX in a wild-type zebrafish embryo expressing GFP-Xcentrin mRNA. (A) z-projection showing central axons extended along the anterior-posterior (A-P) axis (arrowheads) and a branched peripheral axon orthogonal to the A-P axis. The centrosome (yellow circle) is localized near the peripheral axon initiation site (PAS, asterisk). Scale bar: 10 μm. (B) Three-dimensional rendering of the neuron in A (yz view) showing the centrosome at the basal-lateral (Ba-L) cell body surface, near the PAS. (C) Schematic showing how centrosome position (yellow circle) was measured relative to the PAS and centroid (blue circle). (D) Distribution of angle (θ) measurements defined in C. The line between the yellow and red zones indicates 45° angle cut-off. |
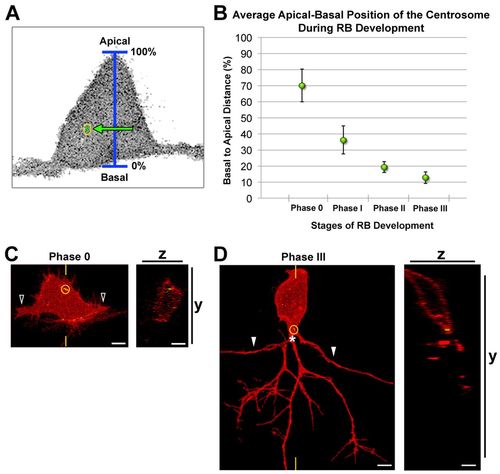
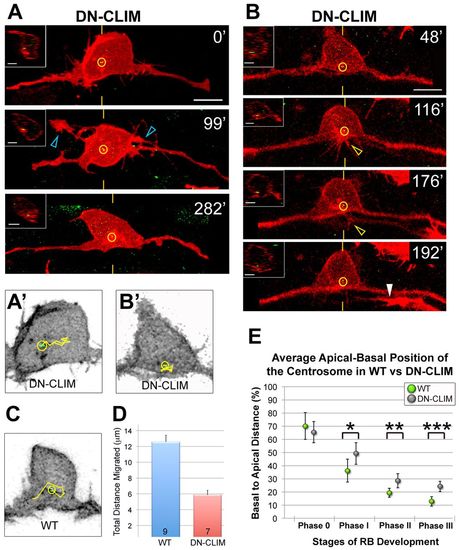
The centrosome occupies a progressively basal position during RB development. (A) Schematic showing how centrosome position (yellow circle) was measured relative to the apical-basal axis. (B) Quantification of average centrosome position and its distribution about the mean (± 2 s.e.m.) during stages of RB development. Mean percentages are: phase 0, 70.0±10.2% (n=13); phase I, 36.1±8.6% (n=12); phase II, 19.3±3.4% (n=14); phase III, 12.7±3.6% (n=11). A total of 36 neurons were analyzed in live zebrafish embryos. (C,D) RB neurons labeled by transient expression of TagRFP-CAAX in GFP-Xcentrin mRNA-expressing wild-type embryos. Images shown are z-projections and optical cross-sections through the centrosome-containing region (indicated with yellow hatch marks). (C) Centrosome position during central axon initiation (phase 0). The open arrowheads indicate central axons. z-projection and xy view show centrosome (yellow circle) localized apically in the cell body. (D) Centrosome position during peripheral extension (phase III). White arrowheads indicate central axons. The centrosome is localized basally, near the PAS (asterisk). Scale bars: 5 μm. |
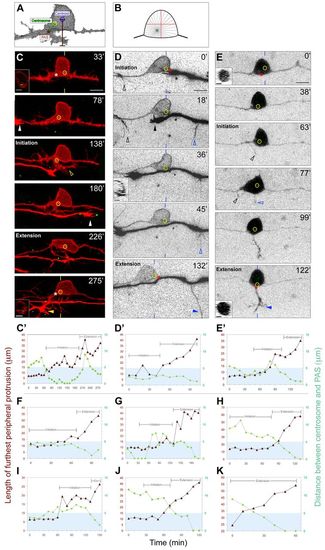
The centrosome localizes near the RB PAS during axon formation. (A) Schematic showing how centrosome localization and peripheral axon length were measured for the plots in C2-E2 and F-K (see Materials and methods). (B) Diagram showing how off-center displacement of the centrosome could cause asymmetric microtubule (MT) delivery. (C-E) Individual RB neurons labeled by transient expression of either TagRFP-CAAX in GFP-Xcentrin mRNA-expressing zebrafish embryos (C,D) or of GFP-Zcentrin (E) alone. Dorsal-lateral views, anterior left. Images are z-projections of RB neuron (red or black-white inverted) overlaid with single xy planes (green) of the centrosome (yellow circles). Insets are optical cross-sections (medial is left) through the region of the cell containing the centrosome (indicated with yellow or blue hatch marks). (C2-E2,F-K) Plots of length of furthest peripheral protrusion (red triangles) and centrosome distance to PAS (green circles) versus time during peripheral axon initiation and extension (brackets). Blue box indicates region within 5 µm of the PAS. (C,C2) Time-lapse images and corresponding plot showing centrosome localization to the PAS during peripheral axon initiation (open arrowhead) and extension. Asterisks at 33′ and 275′ indicate future and formed PAS. White and yellow arrowheads at 782 and 275′ indicate growth cones of neighboring central and peripheral axons entering the field of view. (D,D′) Time-lapse images and corresponding plot showing centrosome localization near the PAS during initiation and extension. A peripheral axon initiates off the ascending central axon (black open arrowhead), but retracts after a second peripheral initiates off the descending central axon (blue open arrowhead) and extends (blue arrowhead). Asterisks at 0′ and 132′ indicate position measured for PAS. Black arrowhead at 18′ indicates growth cone of neighboring central axon. (E,E′) Time-lapse images and corresponding plot showing centrosome localization to the PAS during peripheral axon initiation and extension. A peripheral axon initiates off the ascending central axon (black open arrowheads), but retracts after a second peripheral axon initiates off the cell body (blue open arrowhead) and extends into the periphery (blue arrowhead). Asterisks at 0′ and 122′ indicate future and formed PAS, respectively. Time is in minutes. Plots in F-K are from six additional movies. Scale bars: 10 μm; 5 μm in insets. |
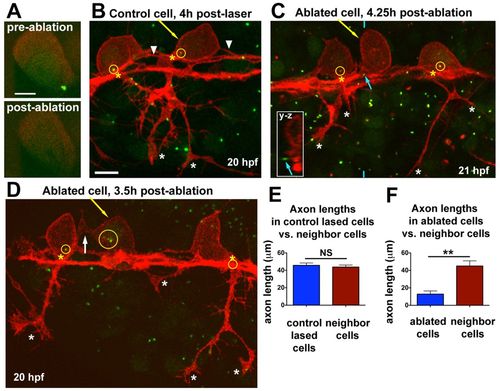
Centrosome ablation causes RB peripheral axon defects and ectopic protrusions. (A) Single optical section showing centrosome (labeled with GFP-Xcentrin) before and immediately after laser ablation. (B-D) z-projections of RB neurons (red) in Tg(–3.1ngn:tagrfp-caax) zebrafish embryos during phase III, overlaid with partial z-projections of GFP-Xcentrin (green) containing the z-planes spanning the cell body of interest. Yellow arrows indicate lased cells, yellow circles show centrosomes within neurons, and yellow asterisks indicate the PAS. (B) Control cell lased away from the centrosome shows normal cell morphology. White asterisks indicate peripheral axon branches of lased cell. Arrowheads indicate central axons. The central axons of neighboring cells are also in view. (C) RB neuron with ablated centrosome lacks a peripheral axon. Blue arrow indicates centrosome outside lased cell, shown in yz cross-section taken at the position of the blue hatch mark (inset). White asterisks indicate peripheral axon branches of non-lased cells. (D) RB neuron with fragmented centrosome lacks a peripheral axon. White arrow indicates an ectopic protrusion from the cell body. Peripheral axons of non-lased cells extend normally (white asterisks). The centrosome of the neuron on the right is obscured by other central axons at the PAS. (E) Mean (±s.e.m.) axon length: control-lased cells, 45.7±2.7 μm; neighbors, 43.8±2.3 μm; NS, not significant (P=0.64, paired t-test). (F) Mean axon length: ablated cells, 12.8±3.7 μm; neighbors, 45.1±5.9 μm; **P=0.0018, paired t-test. Axons from neighboring cells and control cells often extended out of the imaging field and thus their lengths are an underestimate. Control-lased and centrosome-ablated axon lengths are also significantly different from each other (P<0.0001, unpaired t-test). Scale bars: 5 μm in A; 10 μm in B-D. |
Centrosome ablation causes RB peripheral axon defects and ectopic protrusions. (A) Single optical section showing centrosome (labeled with GFP-Xcentrin) before and immediately after laser ablation. (B-D) z-projections of RB neurons (red) in Tg(–3.1ngn:tagrfp-caax) zebrafish embryos during phase III, overlaid with partial z-projections of GFP-Xcentrin (green) containing the z-planes spanning the cell body of interest. Yellow arrows indicate lased cells, yellow circles show centrosomes within neurons, and yellow asterisks indicate the PAS. (B) Control cell lased away from the centrosome shows normal cell morphology. White asterisks indicate peripheral axon branches of lased cell. Arrowheads indicate central axons. The central axons of neighboring cells are also in view. (C) RB neuron with ablated centrosome lacks a peripheral axon. Blue arrow indicates centrosome outside lased cell, shown in yz cross-section taken at the position of the blue hatch mark (inset). White asterisks indicate peripheral axon branches of non-lased cells. (D) RB neuron with fragmented centrosome lacks a peripheral axon. White arrow indicates an ectopic protrusion from the cell body. Peripheral axons of non-lased cells extend normally (white asterisks). The centrosome of the neuron on the right is obscured by other central axons at the PAS. (E) Mean (±s.e.m.) axon length: control-lased cells, 45.7±2.7 μm; neighbors, 43.8±2.3 μm; NS, not significant (P=0.64, paired t-test). (F) Mean axon length: ablated cells, 12.8±3.7 μm; neighbors, 45.1±5.9 μm; **P=0.0018, paired t-test. Axons from neighboring cells and control cells often extended out of the imaging field and thus their lengths are an underestimate. Control-lased and centrosome-ablated axon lengths are also significantly different from each other (P<0.0001, unpaired t-test). Scale bars: 5 μm in A; 10 μm in B-D. |
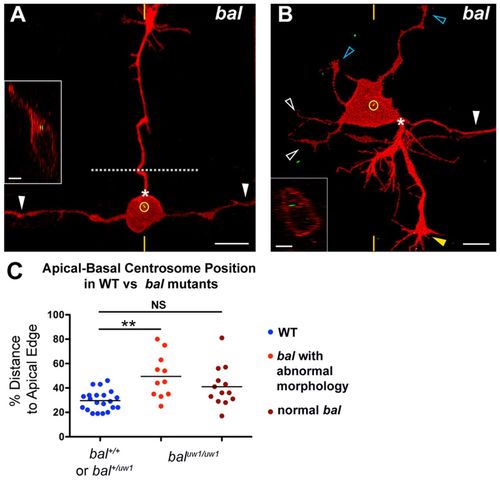
RB neurons have mislocalized centrosomes and aberrant morphology in bal mutant embryos. (A,B) Individual RB neurons labeled by transient expression of TagRFP-CAAX in GFP-Xcentrin mRNA-expressing bal mutant zebrafish embryos. Dorsal-lateral views, anterior left. Images are z-projections and insets are optical cross-sections through the centrosome region (indicated with yellow hatch marks). (A) Mature RB neuron in a bal embryo with normal central axons (white arrowheads) and an ectopic apical axon (PAS indicated by asterisk) that crossed the midline (dotted line) and grew to the contralateral trunk. The centrosome (yellow circle) is localized near the apical cell body edge. (B) Mature RB neuron in a bal embryo with supernumerary axons. Neuron extended a normal descending central axon (white arrowhead) and peripheral axon (yellow arrowhead) from the PAS (asterisk), but has truncated ascending central neurites (white open arrowheads) and ectopic apical neurites (blue open arrowheads). The centrosome (yellow circle) is localized halfway between the apical and basal cell surfaces. (C) Scatter plot of centrosome position. Mean ± s.e.m. for WT: 29.6±1.8 (n=21); abnormal bal, 49.5±5.4 (n=11); normal bal, 41.1±4.5. ANOVA with Tukey’s multiple comparison shows that abnormal bal is significantly different from WT (**P<0.05) and that normal bal is not significantly different (NS) from WT. |