
- Title
-
Muscle contraction controls skeletal morphogenesis through regulation of chondrocyte convergent extension
- Authors
- Shwartz, Y., Farkas, Z., Stern, T., Aszódi, A., and Zelzer, E.
- Source
- Full text @ Dev. Biol.
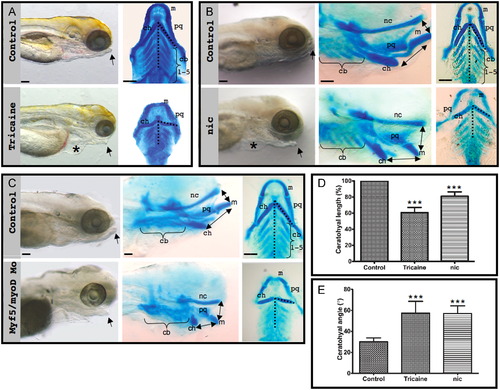
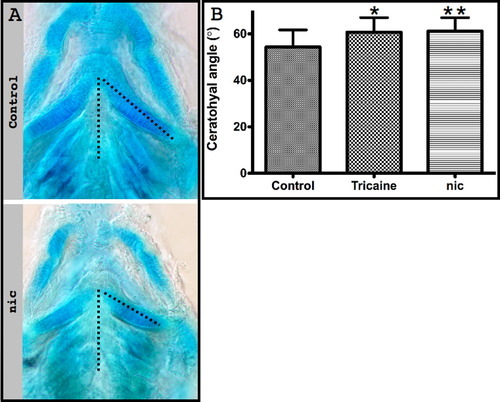
Muscle contraction is necessary for craniofacial morphogenesis. (A) Left: Lateral view of control and tricaine-paralyzed zebrafish embryos at 120 hpf, using bright field microscopy. Right: Ventral view of flat-mounted Alcian blue stained control and tricaine-paralyzed zebrafish. (B) Left: Lateral view using bright field microscopy of control and nic mutant 120 hpf embryos. Lateral view (middle) and flat-mounted ventral view (right) of control and nic mutant zebrafish stained with Alcian blue. (C) Left: Lateral view using bright field microscopy of control and myf5/myod double morphant zebrafish at 120 hpf. Lateral view (middle) and flat-mounted ventral view (right) of control and myf5/myod embryos stained with Alcian blue. Asterisk indicates pericardial edema (A, B). Arrows indicate lower jaw (A)–(C). Double-headed arrows indicate relative location between Meckel′s and ceratohyal cartilages and between Meckel′s cartilage and the neurocranium (B, C). (D) Graph showing the reduction in ceratohyal length in paralyzed zebrafish compared to control (p<0.0001). Both right and left ceratohyal cartilages from twelve tricaine-paralyzed, eight nic mutant and a corresponding number of control embryos were measured at 120 hpf. (E) Graph showing the increase in the angle between ceratohyal cartilage and the midline (dashed line in A–C) in tricaine-paralyzed and nic mutant embryos compared to control (p<0.0001). The angle of both right and left ceratohyal cartilage of 6 tricaine-paralyzed and 11 nic mutants at 120 hpf was measured. Scale bars represent 100 μm. Abbreviations: m: Meckel′s cartilage, ch: ceratohyal cartilage, cb: ceratobranchials, pq: palatoquadrate, nc: neurocranium. PHENOTYPE:
|
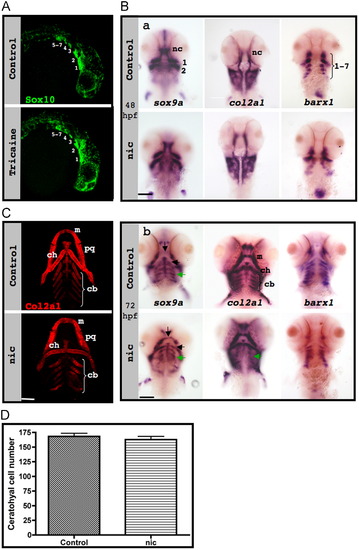
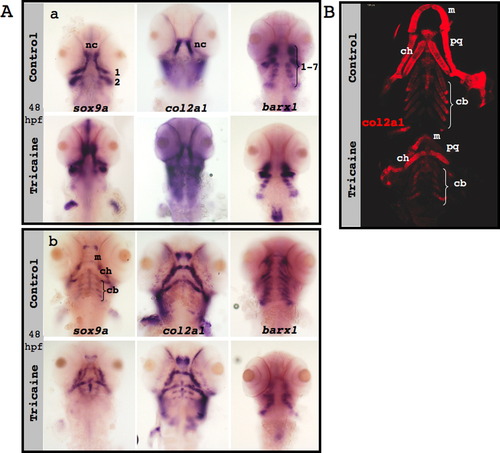
Neural crest specification, migration and differentiation in the absence of muscle contraction. (A) sox10 expression (green) in confocal images of control (upper panel) and paralyzed (lower panel) 25 hpf zebrafish embryos; numbers indicate pharyngeal arches. (B) In situ hybridization of control (upper panels) and nic mutant (lower panels) embryos demonstrates the expression patterns of sox9a (left), col2a1 (middle) and barx1 (right) at 48 hpf (a) and at 72 hpf (b). Green arrows indicate ceratobranchial cartilage, and black arrows indicate Meckel′s cartilage and ceratohyal cartilage. (C) Immunostaining for col2a1 (red) of control (upper panel) and nic mutant 120 hpf zebrafish (lower panel). (D) Counting of cells that compose both ceratohyal cartilages of five controls and six 120 hpf nic mutants (p=0.4909). Scale bars are 100 μm. EXPRESSION / LABELING:
PHENOTYPE:
|
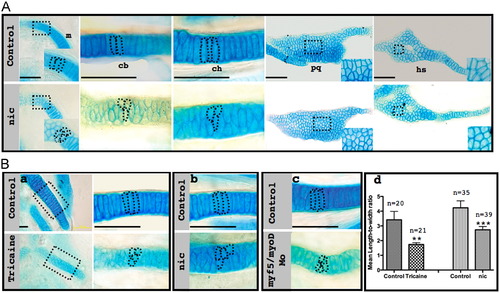
Muscle contraction is essential for creating proper stacking pattern. (A) Flat-mounted Alcian blue stained control (upper panel) and nic mutant (lower panel) 120 hpf zebrafish show the difference in cell morphology in various skeletal elements. Magnifications of squared areas are shown in the lower right corner. Dashed lines demarcate individual cells. (B) Flat-mounted Alcian blue stained control (upper panel) and tricaine-paralyzed (lower panel) ceratohyal cartilage at 120 hpf (a). Right: Magnification of squared areas; dashed lines demarcate individual cells. Flat-mounted Alcian blue stained ceratohyal cartilage from a corresponding location as shown in (a) from control embryos (upper panels), nic mutant (b, lower panel) and myf5/myod double morphants (c, lower panel) at 120 hpf. Quantification of length-to-width ratio (d) in cells from the middle part of the ceratohyal cartilage of control, tricaine-paralyzed (F13.887=35.63, p=0.004) and nic mutant (F1,72=55.44, p=1.65E-10) embryos; n represents number of measured cells; scale bars represent 50 μm. PHENOTYPE:
|
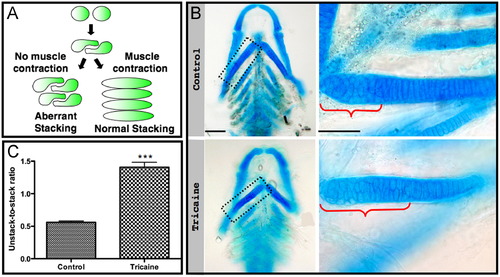
Short-term paralysis results in aberrant stacking. (A) A model illustrating the involvement of muscle contraction in chondrocyte intercalation (modified from Li and Dudley, 2009). (B) Flat-mounted Alcian blue stained control (upper panel) and tricaine-paralyzed (lower panel) 120 hpf zebrafish. Magnifications of the boxed areas are shown on the right. Brackets indicate the length of the area occupied by unstacked chondrocytes. Scale bars are 100 μm on the left and 50 μm on the right. (C) Quantification of the ratio of the lengths of areas of unstacked to stacked chondrocytes in four controls and four paralyzed zebrafish (p<0.0001). |
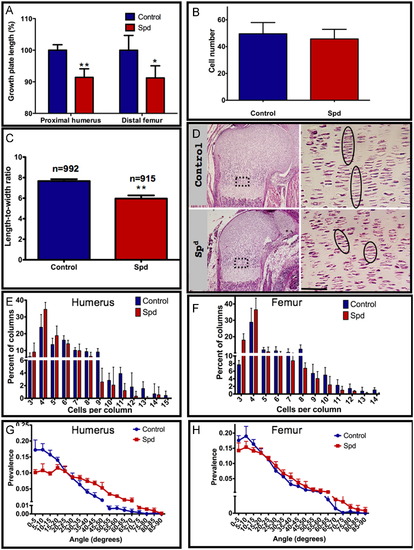
Muscle contraction affects chondrocyte intercalation in mice. (A) Length measurements of humeral and femoral growth plates in control and Spd mutant (humerus: p=0.0017; femur: p=0.027). (B) Quantification of cell number per constant area in control and Spd embryos (p=0.1266). An area of 8732.73 μm2, corresponding to the boxed area in (D) in the humerus growth plate was used for calculation; 4–7 sections from each embryo were analyzed. (C) Quantification of the mean length-to-width ratio of chondrocytes from control and Spd humeral growth plates (F15.5=71.07, p=0.0002). (D) H&E staining of control (upper panel) and Spd (lower panel) humeral growth plates; magnification of the boxed areas is shown on the right. Circles highlight the columnar organization of chondrocytes. (E, F) Comparison of chondrocyte column lengths between control and Spd embryos: Distribution of columns by number of cells per column in the humerus (E; X12=13.093, p=0.0003) and femur (F; X12=14.192, p=0.00017). (G, H) Distribution of angles between adjacent columns in control and Spd mutant in the humerus (G) and femur (H). Both distributions were found to be significantly different (see Table 1 and Table 2). Measurements were made on 4–5 controls and 4–5 mutant embryos from 3–4 different litters; scale bar represents 50 μm. |
|
PHENOTYPE:
|
Reprinted from Developmental Biology, 370(1), Shwartz, Y., Farkas, Z., Stern, T., Aszódi, A., and Zelzer, E., Muscle contraction controls skeletal morphogenesis through regulation of chondrocyte convergent extension, 154-163, Copyright (2012) with permission from Elsevier. Full text @ Dev. Biol.