
- Title
-
Visualization and exploration of Tcf/Lef function using a highly responsive Wnt/beta-catenin signaling-reporter transgenic zebrafish
- Authors
- Shimizu, N., Kawakami, K., and Ishitani, T.
- Source
- Full text @ Dev. Biol.
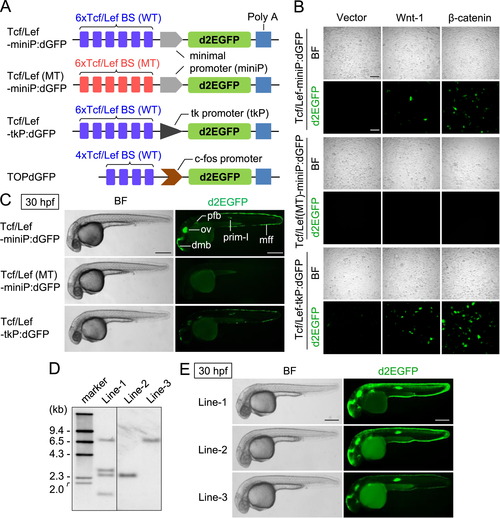
Generation of new Wnt/β-catenin signaling reporters. (A) Schematic diagrams of Wnt/β-catenin signaling-reporter constructs. Tcf/Lef BS: consensus sequence of the Tcf/Lef-binding site. PolyA: SV40 polyadenylation sequence. (B) The Wnt/β-catenin signaling-reporter constructs drive d2EGFP expression in HEK293 cells in response to the activation of Wnt/β-catenin signaling. HEK293 cells were transfected using a reporter gene with a control empty vector (Vector) or an expression plasmid-encoding mouse Wnt-1 (Wnt-1) or β-catenin (β-catenin), as indicated. Scale bar, 200 μm. (C) Comparison of reporter activities in zebrafish embryos transiently introduced with various Wnt/β-catenin signaling-reporter constructs. Left side views of 30-hpf zebrafish embryos injected with either Tcf/Lef-miniP:dGFP, Tcf/Lef(MT)-miniP:dGFP, or Tcf/Lef-tkP:dGFP with Tol2 transposase mRNA, where the anterior is to the left. Cells expressing d2EGFP were visualized by fluorescence microscopy (right panels). Bright-field (BF) images are shown in the left panels. Scale bar, 200 μm. Fluorescence was observed in embryos injected with Tcf/Lef-miniP:dGFP (55%, n=22) and Tcf/Lef-tkP:dGFP (45%, n=20). In contrast, Tcf/Lef(MT)-miniP:dGFP did not express d2EGFP (n=43). dmb: dorsal midbrain, ov: otic vesicle, mff: median fin fold, pfb: pectoral fin bud. (D) Southern blot analysis of the transgenes in Tcf/Lef-miniP:dGFP transgenic zebrafish lines. Genomic DNA was prepared from the tail fins of Line-1, Line-2, and Line-3, and used for Southern blot analysis. (E) Comparison between Line-1, Line-2, and Line-3 reporter activities. Panels show the left side views of 30-hpf Line-1, Line-2, and Line-3 embryos, with the anterior to the left. Cells expressing d2EGFP were visualized by fluorescence microscopy (right panels). Bright-field (BF) images are shown in the left panels. Scale bar, 200 μm. |
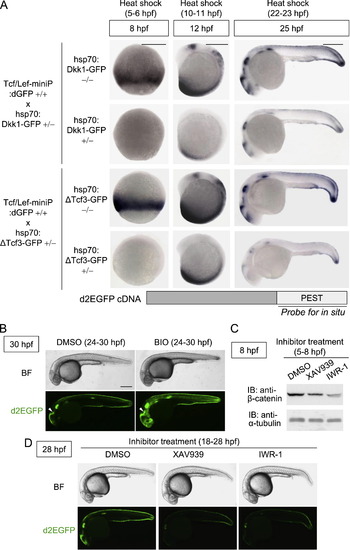
Tcf/Lef-miniP:dGFP reporter expression reflected Wnt/β-catenin signaling in vivo. (A) Dkk1-GFP or ΔTcf3-GFP expression inhibited Tcf/Lef-miniP:dGFP reporter activation. Homozygous Tcf/Lef-miniP:dGFP transgenic zebrafish Line-2 was crossed with heterozygous hsp70:Dkk1-GFP or hsp70:ΔTcf3-GFP transgenic zebrafish. The collected embryos were exposed to heat shock at 37 °C from 5 to 6, 10 to 11, or 22 to 23 hpf. They were then classified as hsp70:Dkk1-GFP carriers (+/-), hsp70:ΔTcf3-GFP carriers (+/-), or non-carriers (-/-) by determining whether Dkk1-GFP or d2EGFP expression was detected by in situ hybridization at 8, 12, or 25 hpf. To determine d2EGFP mRNA expression, the PEST sequence-coding region of d2EGFP was used as a probe (the schematic diagram shown in the lower panel). The left and middle panels show embryos with the ventral side to the left. The right panels show embryos with the anterior side to the left. Scale bar, 100 μm. (B) Tcf/Lef-miniP:dGFP reporter activity was enhanced by BIO treatment. Left-side views of Line-2 treated with 10 μM BIO from 24 to 30 hpf, with the anterior side to the left. (C) XAV939 or IWR-1 treatment reduced the β-catenin protein level. Zebrafish embryos were treated with DMSO or 10 μM XAV939 or IWR-1 from 5 to 8 hpf. Extracts were harvested from embryos at 8 hpf and immunoblotted with anti-β-catenin and anti-α-tubulin antibodies. (D) XAV939 or IWR-1 treatment reduced Tcf/Lef-miniP:dGFP reporter activity. Panels show lateral views of Line-2 treated with DMSO, 10 μM XAV939, or IWR-1 from 18 to 28 hpf, with the anterior side to the left. d2EGFP-expressing cells were visualized by fluorescence microscopy (lower panels). Bright-field (BF) images are shown in the upper panels. Scale bar, 200 μm. |
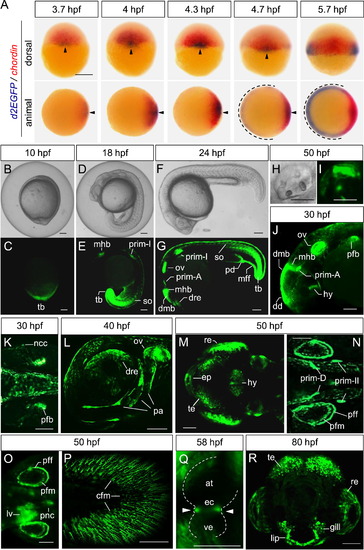
The Tcf/Lef-miniP:dGFP reporter was activated in a range of zebrafish embryo and larval tissues. (A) Whole-mount in situ hybridization of d2EGFP (red) and chordin (blue) at the indicated stage in Tcf/Lef-miniP:dGFP transgenic zebrafish embryos. The upper panels show dorsal views of embryos, with the animal side to the top. The lower panels show animal-side views of embryos, with the dorsal side to the right. The d2EGFP mRNA-expressing dorsal and ventrolateral regions are indicated with arrowheads and broken lines, respectively. Scale bar, 200 μm. (B–R) Expression of d2EGFP proteins in Tcf/Lef-miniP:dGFP transgenic zebrafish embryos and larvae. d2EGFP-expressing cells were visualized by fluorescence microscopy (C, E, G, I–R). (B, D, F, H) show bright-field (BF) images. Scale bar, 200 100 μm. (C–H) Left-side views of 10- (B, C), 18- (D, E), and 24-hpf (F, G) embryos. tail bud (tb), midbrain–hindbrain boundary (mhb), newly formed somites (so), dorsal retina (dre), dorsal midbrain (dmb), otic vesicle (ov), pronephric duct (pd), and median fin fold (mff). (H, I) Otic vesicle of 50-hpf embryos, with the anterior to the left and dorsal to the top. (J, K) Left-side head (J) and dorsal trunk (K) views of 30-hpf embryos. dorsal diencephalon (dd), hypothalamus (hy), pectoral fin bud (pfb), and neural crest cells (ncc). (L) Lower left-side head view of 40-hpf embryos. Developing pharyngeal arch (pa). (M–P) Dorsal head (M), dorsal trunk (N, O), and left-side tail (P) views of 50-hpf embryos were observed by macro confocal microscopy (M, N, P) or using a fluorescence stereomicroscope (O). Tectum (te), retina (re), epiphysis (ep), pectoral fin fold (pff) and mesenchymal cells (pfm), liver (lv), pancreas (pnc), and caudal fin mesenchymal cells (cfm). (Q) Heart of 58-hpf embryos. The endocardial cushion (ec) is indicated with white arrowheads. Atrium (at), ventricle (ve). (R) Front facial view of an 80-hpf embryo, with the dorsal side to the top. |
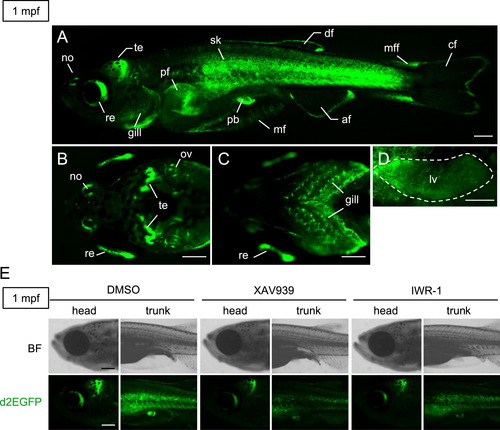
Tcf/Lef-miniP:dGFP transgenic zebrafish expressed d2EGFP in various tissues during juvenile growth processes. (A–D) d2EGFP protein expression in 1 mpf Tcf/Lef-miniP:dGFP transgenic zebrafish. Lateral (A), dorsal head (B), ventral head (C), and lateral liver (D) views of transgenic fish, with the anterior side to the left. d2EGFP-expressing cells were visualized by fluorescence microscopy. Scale bar, 200 μm. Nose (no), retina (re), tectum (te), gill, pectoral fin (pf), skin (sk), pelvic fin (pf), median fin mesenchymal cell (mf), anal fin (af), dorsal fin (df), median fin fold (mff), and caudal fin (cf). We could not distinguish d2EGFP expression in the liver or skin of intact fish (data not shown). Therefore, the skin was peeled away to clearly visualize expression in the liver (D). (E) XAV939 or IWR-1 treatment reduced the β-catenin protein level and Tcf/Lef-miniP:dGFP reporter activity. The panels show left-side head or trunk views of 1-mpf Line-2 juveniles treated with DMSO or 10 μM XAV939 or 10 μM IWR-1 for 24 h, with the anterior side to the left. d2EGFP-expressing cells were visualized by fluorescence microscopy (lower panels). Bright-field (BF) images are shown in the upper panels. Scale bar, 200 μm. |
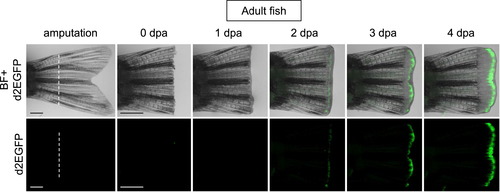
Tcf/Lef-miniP:dGFP reporter was activated in the amputated caudal fin regenerative outgrowths of adult transgenic fish. The caudal fin was amputated at the white line indicated, as shown for 4 dpa (0–4 dpa). d2EGFP-expressing cells were visualized by fluorescence microscopy (lower panels). The fluorescence images were merged with bright-field (BF) images (upper panels). The Tcf/Lef-miniP:dGFP reporter was upregulated in the amputated fin during regeneration. Scale bar, 200 μm. |
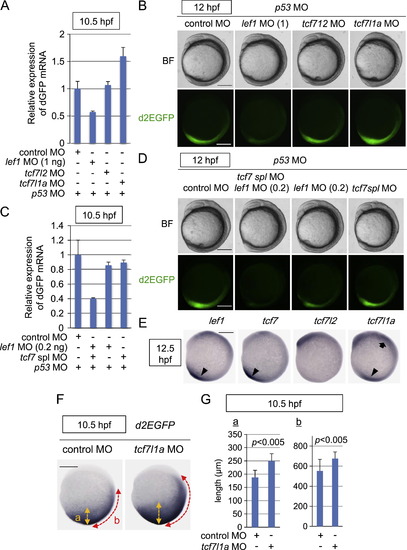
Tcf/Lef-miniP:dGFP reporter activity during early embryogenesis was dependent on the Tcf/Lef family of transcription factors. (A–D) The Tcf/Lef-miniP:dGFP reporter activity was regulated positively by Lef1, Tcf7, and Tcf7l2 and negatively by Tcf7l1a. Control MO, 1 or 0.2 ng of lef1 MO, tcf7l2 MO, tcf7l1a MO, or tcf7 spl MO was coinjected with p53 MO into one cell-stage Line-2 embryos, as indicated. (A, C) At 10.5 hpf, 20 embryos were collected and their total RNA was purified. The relative expression levels of d2EGFP mRNAs at 10.5 hpf were analyzed by qPCR. (B, D) Left-side views of MO-injected reporter fish embryos, as indicated, with the anterior side to the top. Scale bar, 200 μm. (E) Whole-mount in situ hybridization staining for lef1, tcf7, tcf7l2, and tcf7l1a in 12.5-hpf zebrafish embryos. Tcf/Lef mRNA expression in the anterior and posterior tissues is indicated with arrows and arrowheads, respectively. Scale bar, 200 μm. (F, G) Tcf7l1a negatively regulated Tcf/Lef-miniP:dGFP reporter activity. Control MO (n=28) or tcf7l1a MO (n=38) was coinjected with p53 MO into one cell-stage Line-2 embryos as indicated. (F) Whole-mount in situ hybridization staining for d2EGFP using 10.5-hpf MO-injected Line-2 embryos. Scale bar, 200 μm. (G) The width of the d2EGFP mRNA-expressing area was quantified by measuring the lengths of “a” and “b”, which are indicated in (F), using Image J (NIH). |
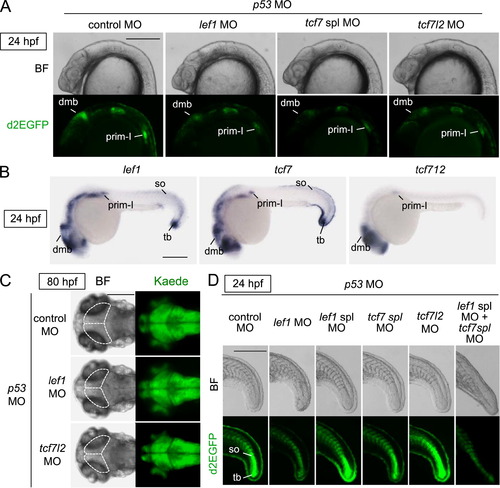
The Tcf/Lef family of transcription factors was required for Wnt/β-catenin signaling activity in the midbrain, pLL, and tail bud. (A, D) Tcf/Lef-miniP:dGFP reporter activity in the dorsal midbrain (dmb) and prim-I was dependent on Lef1, Tcf7, and Tcf7l2, and this activity in the newly formed somites (so) and tail bud (tb) was regulated by Lef1 and Tcf7. Control MO, lef1 MO, tcf7 spl MO, tcf7l2 MO, or lef1 spl MO was coinjected with p53 MO into one cell-stage Line-2 embryos, as indicated. Left-side head (A) and tail (D) views of MO-injected Line-2 embryos, with the anterior side to the left. Bright-field (BF) images are shown in the upper panels. d2EGFP-expressing cells were visualized by fluorescence microscopy (lower panels). Scale bar, 200 μm. (B) Whole-mount in situ hybridization staining for lef1, tcf7, and tcf7l2 using 24-hpf (D) zebrafish embryos. Tcf/Lef mRNAs were detected in the dorsal midbrain (dmb), prim-I, newly formed somites (so) and tail bud (tb). Scale bar, 200 μm. (C) Tcf7l2 was required for midbrain development. Dorsal views of 80-hpf HuC-Kaede transgenic zebrafish embryos injected with control MO, lef1 MO, tcf7l2 MO, or p53 MO. In A, bright-field (BF) images are shown in the left panels. Kaede-expressing cells were observed by fluorescence microscopy (right panels). Broken lines indicate the tectum or presumptive tectal region. Scale bar, 100 μm. |
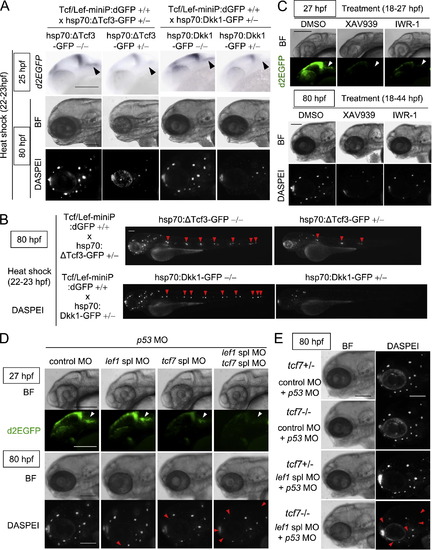
Tcf7/Lef1-mediated Wnt/β-catenin signaling was required for aLL development. (A, B) Induction of ΔTcf3-GFP or Dkk1-GFP expression blocked Tcf/Lef-miniP:dGFP reporter activity in prim-A and reduced the neuromast number. hsp70:ΔTcf3-GFP- or hsp70:Dkk1-GFP-carrying Line-2 embryos were generated and classified using methods similar to those shown in Fig. 2(A). hsp70:Dkk1-GFP carriers (+/-), hsp70:ΔTcf3-GFP carriers (+/) or non-carriers (-/-) were exposed to heat shock for 1 h at 37 °C at 22 hpf. d2EGFP expression was detected by in situ hybridization 2 h after heat shock (top panels in A). Neuromasts were visualized at 80 hpf by DASPEI staining (A, B). Panels show head (A) or entire (B) views of embryos, with the anterior side to the left. Bright-field (BF) images are shown in the middle panels (A). DASPEI-stained cells were observed by fluorescence microscopy (bottom panels in A, panels in B). prim-As (A) and DASPEI-stained prim-I-derived primary neuromasts (B) are indicated with black and red arrowheads, respectively. Scale bar, 100 μm. (C) XAV939 or IWR-1 treatment reduced Tcf/Lef-miniP:dGFP reporter activity in prim-A and the number of prim-A-derived neuromasts. Panels show left-side head views of 27- and 80-hpf zebrafish embryos treated with DMSO, 10 μM XAV939, or IWR-1 from 18 to 27 hpf or 18 to 44 hpf, with the anterior side to the left. Bright-field (BF) images are shown in the top and third panels. d2EGFP-expressing cells (second panels) and DASPEI-stained cells were observed by fluorescence microscopy (bottom panels). Scale bar, 100 μm. (D, E) Tcf7 and Lef1 contributed to aLL development. Left-side views of 27- or 80-hpf Line-2 (D) heterozygous (+/-) or homozygous (-/-) tcf7 mutant (E) embryos injected with control MO, tcf7 MO, lef1 spl MO, and p53 MO, as indicated, with the anterior side to the left. Heterozygous (+/-) tcf7 mutant embryos were obtained by crossing homozygous (-/-) tcf7 mutants with wild-type zebrafish. Bright-field (BF) images are shown in the top and third panels (D) or the left panels (E). d2EGFP-expressing cells (second panels in D) and DASPEI staining (bottom panel in D and right panels in E) were visualized by fluorescence microscopy. prim-As are indicated with white arrowheads. The missing neuromasts in the morphants are indicated with red arrowheads. Scale bar, 100 μm. |
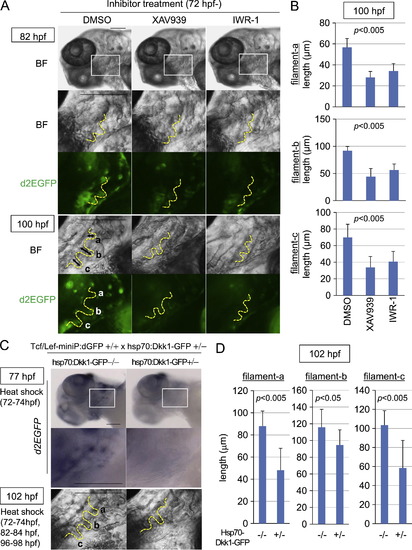
Wnt/β-catenin signaling was required for gill filament growth. (A–D) XAV939 or IWR-1 treatment or induction of Dkk1-GFP expression blocked Tcf/Lef-miniP:dGFP reporter activity in gill filament buds and reduced the gill filament length. (A, B) Line-2 embryos were treated with DMSO, 10 μM XAV939, or 10 μM IWR-1 from 72 hpf. Panels show lower left-side head views (top panels) and magnified gill area views (second, third, forth, and bottom panels) of 82- and 100-hpf inhibitor-treated Line-2 embryos, with the anterior side to the left. Insets in the top panels indicate the gill areas shown in the second and third panels. Bright-field (BF) images are shown in the top, second, and fourth panels in (A). d2EGFP expression was observed by fluorescence microscopy (third and bottom panels in A). The outlines of the gill filaments and their buds are shown with yellow broken lines. Scale bar, 100 μm. (C, D) hsp70:Dkk1-GFP-carrying Line-2 embryos were generated and classified using methods similar to those shown in Fig. 2(A). hsp70:Dkk1-GFP carriers (+/-) or non-carriers (-/-) were exposed to heat shock for 2 h at 37 °C at 72 hp. d2EGFP expression was detected by in situ hybridization 3 h after heat shock (top and middle panels in C). Panels show lower left-side head views (top panels) and magnified gill area views (middle and bottom panels) for 77- and 102-hpf inhibitor-treated Line-2 embryos, with the anterior side to the left. Insets in the top panels indicate the gill areas shown in the second panels. The embryos shown in the bottom panels were exposed to two additional heat shock treatments for 2 h at 37 °C at 82 and 96 hpf. The outlines of the gill filaments and their buds are shown with yellow broken lines. Scale bar, 100 μm. Three gill filaments that budded from branchial arch 1 are labeled as a, b, and c, and their lengths are shown. (B, D) Graphs showing the lengths of the gill filaments indicated in (A) and (C) for 100-hpf inhibitor-treated reporter fish embryos (B, n=10 each) or 102-hpf heat shock-exposed embryos (D, n=11 each). Data are mean±SD. The p value was calculated by Student′s t test. The gill filament length in 100-hpf DMSO-treated embryos (B) was shorter than that in 102-hpf hsp70:Dkk1-GFP non-carriers (-/-). This may be due to differences in the treatment. |
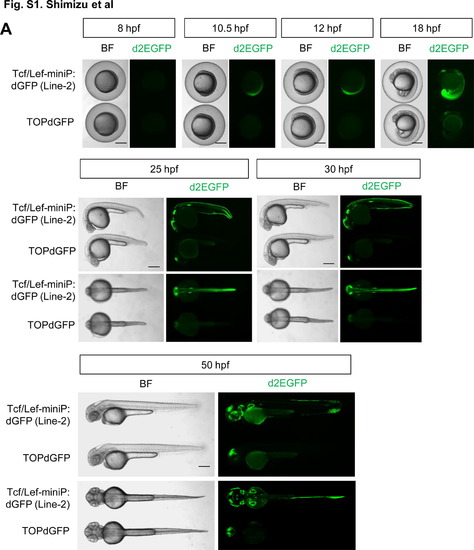
Comparison of reporter activity in Tcf/Lef-miniP:dGFP- and TOPdGFP transgenic zebrafish embryos (A, B) Comparison of the reporter fluorescence activity in Tcf/Lef-miniP:dGFP and TOPdGFP transgenic zebrafish embryos. (A) Left side (panels for 8, 10.5, 12, and 18 hpf, and upper panels for 25, 30, and 50 hpf) and dorsal (lower panels for 25, 30, and 50 hpf) views of Line-2 or TOPdGFP transgenic zebrafish embryos, with the ventral side to the left (panels for 8, 10.5, 12, and 18 hpf) or the anterior side to the left (panels for 25, 30, and 50 hpf). Scale bar, 250 μm. (B) Panels show Line-2 and TOPdGFP transgenic embryos, which were collected randomly by non-fluorescence microscopy. (A, B) d2EGFP-expressing cells were visualized by fluorescence microscopy (right panels). Bright-field (BF) images are shown in the left panels. Scale bar, 500 μm. We confirmed that the reporter fluorescence activity was uniform in each Line-2 embryo and was much stronger than that in TOPdGFP fishes throughout embryonic development. (C) Comparison of the d2EGFP mRNA expression level in Tcf/Lef-miniP:dGFP- and TOPdGFP transgenic zebrafish embryos. At the stages indicated, 20 embryos were collected and their total RNA was purified. The relative expression levels of d2EGFP mRNAs were analyzed by qPCR. The p value was calculated by Student′s t test. We confirmed that the d2EGFP mRNA expression level in Line-2 was much higher than that in TOPdGFP fishes throughout embryonic development. |
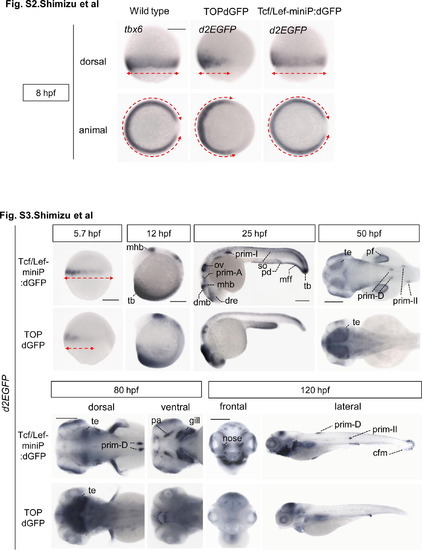
The expression pattern of the Tcf/Lef-miniP:dGFP reporter at 8 hpf, but not that of the TOPdGFP reporter, was completely consistent with that of tbx6 mRNA. Whole-mount in situ hybridization staining for tbx6 in wild-type zebrafish embryos and for d2EGFP mRNA in Tcf/Lef-miniP:dGFP and TOPdGFP transgenic zebrafish embryos at 8 hpf. The expression domains of tbx6 and d2EGFP mRNAs are indicated with red broken lines. Tcf/Lef-miniP:dGFP reporter activity and tbx6 mRNA were detected in both the ventral and dorsal lateral regions. In contrast, TOPdGFP reporter activity was observed only in the ventral region but not in the dorsal lateral region, indicating that the expression pattern was not completely consistent with that of tbx6 mRNA. and Figure S3. Comparison of the expression pattern of d2EGFP mRNA in Tcf/Lef-miniP:dGFP and TOPdGFP transgenic zebrafish embryos. Left-side (panels for 5.7, 12, and 25 hpf, and right panel for 120 hpf), dorsal (panels for 50 hpf and left panels for 80 hpf), ventral (right panels for 80 hpf), and frontal (left panels for 120 hpf) views of Line-2 or TOPdGFP-transgenic zebrafish embryos, with the ventral side to the left (panels for 5.7 and 12 hpf), the anterior side to the left (panels for 25, 50, and 80 hpf, and right panels for 120 hpf), or the dorsal side to the top (left panels for 120 hpf). Scale bar: 200 μm. The expression domains of d2EGFP mRNA at 5.7 hpf are indicated with red broken lines. The expression domains of tbx6 and d2EGFP mRNAs are indicated with red broken lines. At 5.7 hpf, the d2EGFP mRNA-expressing domain in TOPdGFP transgenic fish was narrower than that in Line-2. d2EGFP mRNA expression was detected in the median and pectoral fin fold (mff and pff), caudal fin mesenchymal cell (cfm), prim-A, prim-II, prim-D, developing pharyngeal arch (pa), gill, and nose in Line-2 embryos, but not in TOPdGFP fish embryos. |
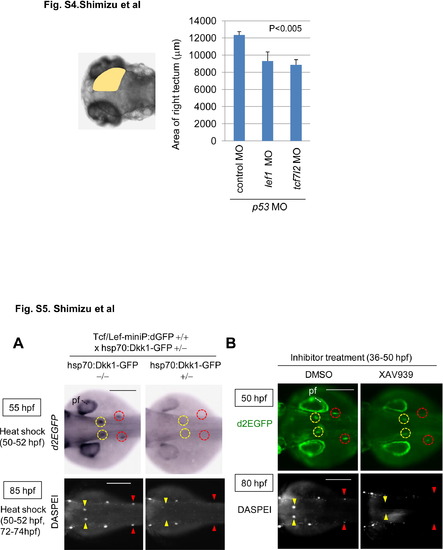
Knockdown of lef1 or tcf7l2 reduces the size of the midbrain tectum at 80 hpf. Graphs show the area of 80 hpf zebrafish embryos injected with control MO (n = 13), lef1 MO (n = 17), or tcf7l2 MO (n = 15) with p53 MO. The p value was calculated by Student′s t test. and Figure S5. Wnt/β-catenin signaling was required for dorsal and secondary pLL development. (A, B) Induction of Dkk1-GFP expression or XAV939 treatment blocked Tcf/Lef-miniP:dGFP reporter activity in the prim-D and prim-II and reduced the neuromast number. (A) hsp70:Dkk1-GFP-carrying Line-2 embryos were generated and classified using methods similar to those shown in Fig. 2A. Normal Line-2 embryos or hsp70:Dkk1-GFP-carrying Line-2 embryos were exposed to heat shock for 2 h at 37°C at 50 hpf. d2EGFP expression was detected by in situ hybridization 3 h after heat shock (top panels in A). Neuromasts were visualized by DASPEI staining 11 h after additional heat shock for 2h at 37°C at 72 hpf. Panels show trunk views of embryos, with the anterior side to the left. (B) Panels show trunk views of 50- (upper panels) and 80-hpf (lower panels) reporter fish embryos treated with DMSO or 10 μM XAV939 from 36 to 50 hpf, with the anterior side to the left. d2EGFP-expressing cells were visualized by fluorescence microscopy (lower panels). (A, B) DASPEI-stained cells were observed by fluorescence microscopy. prim-Ds and prim-IIs are surrounded with yellow and red circles, respectively. DASPEI-stained prim-D- and prim-II-derived neuromasts are indicated with yellow and red arrowheads, respectively. Note that Dkk1-GFP expression or XAV939 treatment also reduced d2EGFP expression in the pectoral fin fold (pf). Scale bar, 200 μm. and Knockdown of lef1 or tcf7l2 reduces the size of the midbrain tectum at 80 hpf. Graphs show the area of 80 hpf zebrafish embryos injected with control MO (n = 13), lef1 MO (n = 17), or tcf7l2 MO (n = 15) with p53 MO. The p value was calculated by Student′s t test. and Figure S5. Wnt/β-catenin signaling was required for dorsal and secondary pLL development. (A, B) Induction of Dkk1-GFP expression or XAV939 treatment blocked Tcf/Lef-miniP:dGFP reporter activity in the prim-D and prim-II and reduced the neuromast number. (A) hsp70:Dkk1-GFP-carrying Line-2 embryos were generated and classified using methods similar to those shown in Fig. 2A. Normal Line-2 embryos or hsp70:Dkk1-GFP-carrying Line-2 embryos were exposed to heat shock for 2 h at 37°C at 50 hpf. d2EGFP expression was detected by in situ hybridization 3 h after heat shock (top panels in A). Neuromasts were visualized by DASPEI staining 11 h after additional heat shock for 2h at 37°C at 72 hpf. Panels show trunk views of embryos, with the anterior side to the left. (B) Panels show trunk views of 50- (upper panels) and 80-hpf (lower panels) reporter fish embryos treated with DMSO or 10 μM XAV939 from 36 to 50 hpf, with the anterior side to the left. d2EGFP-expressing cells were visualized by fluorescence microscopy (lower panels). (A, B) DASPEI-stained cells were observed by fluorescence microscopy. prim-Ds and prim-IIs are surrounded with yellow and red circles, respectively. DASPEI-stained prim-D- and prim-II-derived neuromasts are indicated with yellow and red arrowheads, respectively. Note that Dkk1-GFP expression or XAV939 treatment also reduced d2EGFP expression in the pectoral fin fold (pf). Scale bar, 200 μm. |
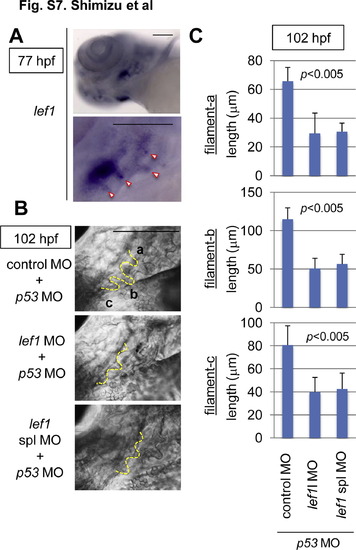
Lef1 was required for gill filament growth. (A) Whole-mount in situ hybridization staining for lef1 in 77-hpf zebrafish embryos. Panels show lower left-side head views (upper panel) and magnified gill area views (lower panel) of embryos, with the anterior side to the left. The gill filament bud-expressing lef1 mRNA is indicated with arrowheads. Scale bar, 100 μm. (B, C) lef1 knockdown reduced the gill filament length. Zebrafish embryos were injected with control MO (n = 9), lef1 MO (n = 13), or lef1 spl MO (n = 9) with p53 MO, as indicated. (B) Panels show gill area views of 120-hpf MO-injected embryos, with the anterior side to the left. The outlines of gill filaments and their buds are shown with yellow broken lines. Scale bar, 100 μm. Three gill filaments budded from branchial arch 1 are labeled a, b, and c, and their lengths are shown. (C) Graphs show the lengths of the labeled gill filaments, as indicated in B, of 102-hpf MO-injected embryos (n = 11 each). Data are mean ± SD. The p value was calculated by Student′s t test. |
Reprinted from Developmental Biology, 370(1), Shimizu, N., Kawakami, K., and Ishitani, T., Visualization and exploration of Tcf/Lef function using a highly responsive Wnt/beta-catenin signaling-reporter transgenic zebrafish, 71-85, Copyright (2012) with permission from Elsevier. Full text @ Dev. Biol.