
- Title
-
Fgfr-Ras-MAPK signaling is required for apical constriction via apical positioning of Rho-associated kinase during mechanosensory organ formation
- Authors
- Harding, M.J., and Nechiporuk, A.V.
- Source
- Full text @ Development
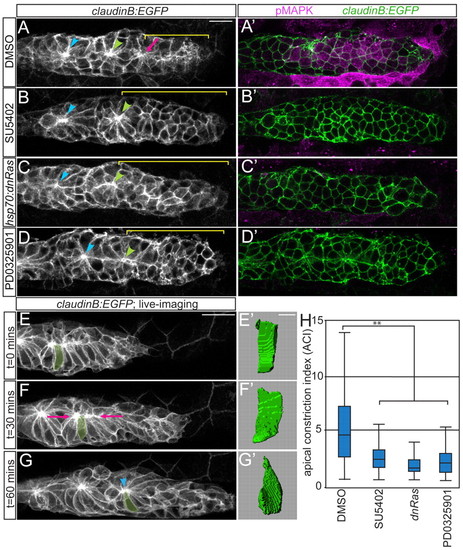
Fgfr-Ras-MAPK signaling in the pLLp is required for rosette formation. (A-D) Confocal projections showing rosette formation in the DMSO control (A) and with Fgfr (B), Ras (C) and MAPKK (D) inhibition in claudinB:EGFP zebrafish embryos at 30 hpf. Arrowheads indicate centers of the trailing rosettes. Pink arrow indicates nascent rosette. Brackets indicate rosette-free region. (A2-D2) pMAPK immunolabeling in single planes from projections in A-D. Fgfr and MAPKK inhibition with 100 μM SU5402 and 7 μM PD0325901, respectively, was from 28-30 hpf. Ras inhibition via hsp70:dn-Ras induction was at 28 hpf; embryos were fixed 2 hours following heat shock. (E-G) Stills from time-lapse movie of pLLp in a wild-type claudinB:EGFP embryo (supplementary material Movie 1). (F) Cells align apical ends along the midline (pink arrows). (G) Center of the nascent rosette (arrowhead). (E2-G2) Three-dimensional reconstructions of the highlighted cell in E-G. (H) ACIs for embryos treated with DMSO, SU5402, PD0325901 or following induction of hsp70:dn-Ras. n=180 cells from six embryos per condition. **P<0.0001, Wilcoxon test. Error bars indicate s.e.m. Scale bars: 20 μm in A-G; 4 μm in E2-G2. |
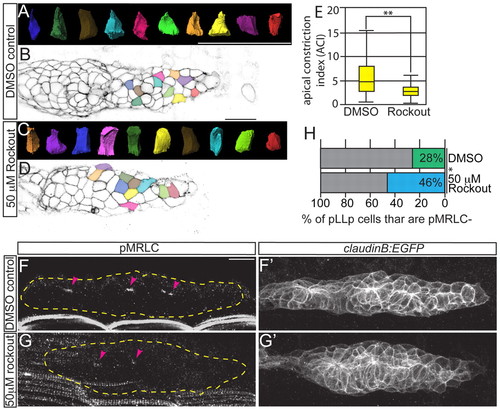
Rho kinase activity is required for rosette formation, apical constriction and MRLC activation. claudinB:EGFP zebrafish embryos were treated from 28 to 30 hpf with the Rho kinase inhibitor Rockout. (A-D) ACIs were then measured for the leading-most 30 cells (C,D) and compared with DMSO-treated controls (A,B). Colors of surfaces in A,C correspond to cell positions in B,D. (E) ACI measurements from embryos treated with Rockout or DMSO. n=180 cells from six embryos per condition. **P<0.0001, Wilcoxon test. Error bars indicate s.e.m. (F-G2) Immunolabeling showing loss of pMRLC from the leading region following Rockout treatment as compared with control. (H) Quantification of the leading region, where pMRLC is not detected. *P<0.0001, Student’s t-test. Percentages were derived by counting the number of cells caudal to the distalmost pMRLC signal (i.e. the number of leading cells that lacked the signal) and normalizing to the total number of cells in the pLLp. Scale bars: 20 μm. |
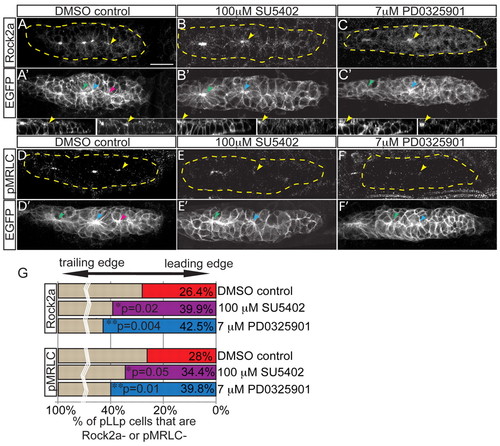
Fgf and MAPK signaling are required for localization of Rock2a and MRLC activation. (A-F2) Fgfr or MAPKK inhibition with SU5402 or PD0325901, respectively, from 28-30 hpf in claudinB:EGFP zebrafish embryos. Lower panels show sagittal view of leading pLLp region (left, EGFP; right, Rock2a). Post-treatment, Rock2a (A-C) and pMRLC (D-F) were assayed by immunolabeling. Yellow arrowheads indicate the caudal-most apical accumulation of Rock2a. Note that Rock2a is not localized to apical ends of cells in the leading region following treatments. pMRLC staining shows failure of leading-region MRLC activation following treatments. (G) Quantification of the leading region (performed as in Fig. 2H). Rock2a (n=6 embryos; P<0.03, ANOVA) and pMRLC (n=6 embryos; P<0.003, ANOVA) are not apically localized. Note there are fewer leading cells with apically localized Rock2a in Fgf-inhibited (39.9±1.1%) and MAPKK-inhibited (42.5±1.4%) embryos compared with the control (26.4±1.5%). For pMRLC staining: DMSO, 28.0±0.7%; SU5402, 34.4±0.6%; and PD0325901, 39.8±1.0%. Scale bar: 20 μm. |
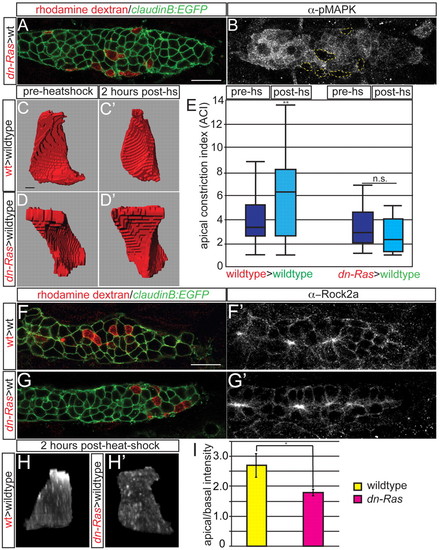
Ras-MAPK signaling mediates cell-autonomous apical constriction and Rock2a localization. (A,B) claudinB:EGFP-positive mosaic zebrafish embryos containing hsp70:dn-Ras donor cells (red) at 30 hpf. Note the lack of pMAPK labeling in dn-Ras cells. (C-D2) Before heat shock, both dn-Ras and wild-type donor cells are columnar; 2 hours after heat shock, the wild-type cell is constricted, whereas the dn-Ras cell remains columnar. (E) Quantification of ACIs of transplanted wild-type and hsp70:dn-Ras cells before and after heat shock. n=50 cells from ten embryos. **P<0.009, Wilcoxon test. n.s., not significant. (F-G2) Transplantation of hsp70:dn-Ras or wild-type cells causes no obvious differences in global Rock2a distribution. (H,H2) Rock2a distribution in a single transplanted cell shows failure of Rock2a apical localization when Ras is inhibited. (I) Ratio of apical to basal fluorescence intensity in transplanted wild-type cells and dn-Ras cells. n=15 cells from four embryos per condition. *P<0.03, ANOVA. Error bars indicate s.e.m. Scale bars: 20 μm in A,F; 2 μm in C. |
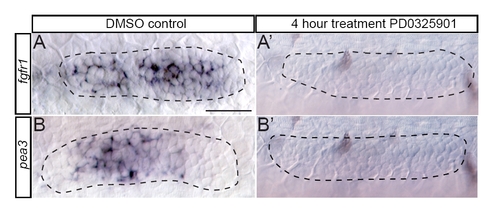
Inhibition of MAPKK phenocopies loss of Fgfr signaling. Inhibition of MAPKK with the pharmacological inhibitor PD0325901 between 28 and 32 hpf resulted in a loss of fgfr1 (A2) and pea3 (B2) transcripts, compared with DMSO-treated controls (A,B). Scale bar: 30 μm. |
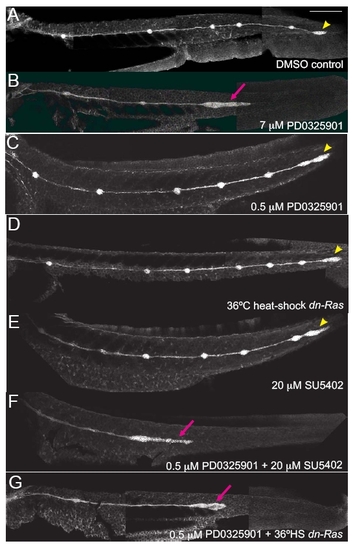
Fgfr, Ras and MAPK synergize during formation of the posterior lateral line. Activity of Fgfr, Ras or MAPKK was modulated in claudinB:EGFP transgenic embryos using pharmacological inhibitors (SU5402 for Fgfr and PD0325901 for MAPKK) or expression of a dominant-negative transgene hsp70:dn-Ras between 30 and 48 hpf. (A) In 48-hour-old DMSO-treated controls, embryos have deposited 5-6 neuromasts (NMs) along the trunk, and the pLLp has reached the end of the tail to form the terminal cluster of neuromasts. (B) Treatment with an optimal dose of PD0325901 (7 μM) caused a failure of distal neuromast deposition and a stalling of the pLLp. (C) A suboptimal dose of MAPKK inhibitor PD0325901 (0.5 μM) did not affect neuromast deposition or pLLp migration. (D,E) Suboptimal inhibition of Ras (36°C heat shock of hsp70:dn-Ras transgenics) or Fgfr (treatment with 20 µM SU5402) did not affect neuromast deposition or pLLp migration. (F,G) Combining suboptimal PD0325901 treatment with suboptimal SU5402 treatment or suboptimal heat shock of hsp70:dn-Ras resulted in stalling of the pLLp and failed neuromast deposition. Scale bar: 200 μm. |
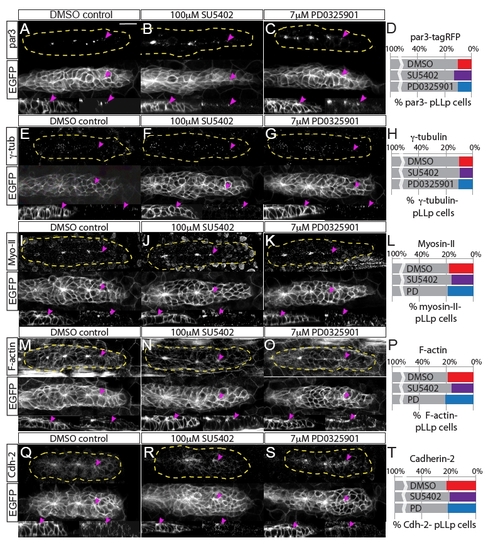
Fgfr-Ras-MAPK signaling does not disrupt localization of polarity molecules or the actomyosin cytoskeleton. Analyses of polarity and cytoskeletal recruitment in the pLLp. (A-C) Par3 localization was examined by overexpression of par3-TagRFP. (E-G,I-K,M-O,Q-S) Immunohistochemistry was used to examine localization of (E-G) γ-tubulin, (I-K) Myosin II, (M-O) F-actin and (Q-S) Cadherin 2. Each panel shows immunohistochemistry for the indicated molecule (top), claudinB:EGFP (middle) and sagittal views of the leading edge (claudinB:EGFP, bottom left; and immunolabeling against indicated molecule, bottom right). All molecules are properly localized to the apical domains of cells in the leading region of the pLLp, including pLLps in embryos treated with Fgfr or MAPKK inhibitors (2-hour treatment, 28-30 hpf). Pink arrowheads indicate the most caudal accumulation of each molecule. (D,H,L,P,T) Quantification of recruitment of polarity/cytoskeletal molecules to the apical domains of pLLp cells, showing the percentage of pLLp cells that do not display apically localized Par3-TagRFP, γ-tubulin, F-actin, Myosin II or Cadherin 2. Percentages were derived by counting the number of cells caudal to a given distalmost signal (i.e. the number of leading cells that lacked the signal) and normalizing to the total number of cells in the pLLp. There is no significant difference in the recruitment of any of these molecules (one-way ANOVA). Scale bar: 20 μm. |
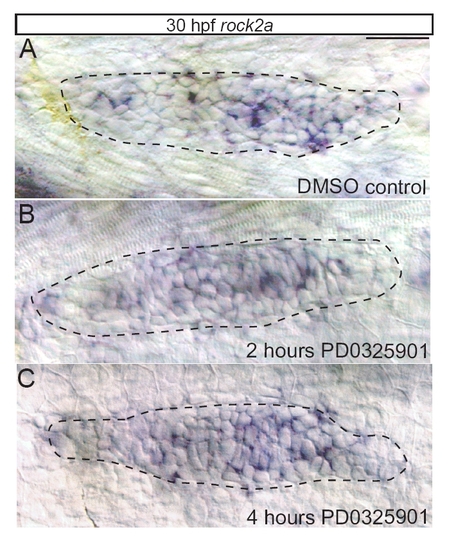
MAPK does not regulate the levels or distribution of rock2a transcript in the pLLp. (A) In situ hybridization against rock2a in the pLLp at 30 hpf. rock2a transcript is present throughout the pLLp. (B,C) Inhibition of MAPKK for 2 hours (B) or 4 hours (C) does not change overall levels or distribution of rock2a. Scale bar: 30 μm. |
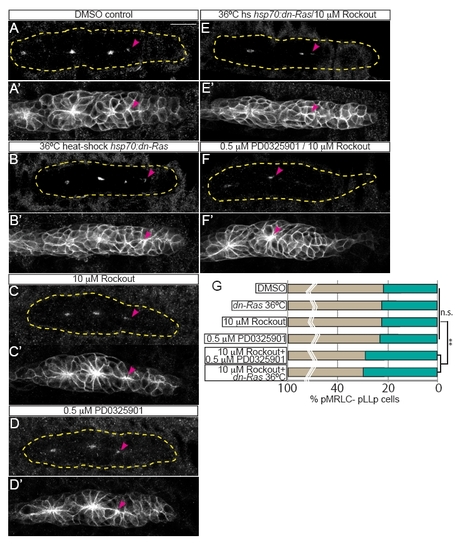
Ras-MAPK and Rock synergize to activate MRLC. (A-D) Suboptimal inhibition conditions did not disrupt activation of pMRLC in the leading edge of the pLLp. Suboptimal doses and heat shock conditions were determined empirically by titrating treatments to the highest level at which there was no effect on MRLC activation (0.5 μM PD0325901, 10 μM Rockout, 36°C heat shock of hsp70:dn-Ras transgenics). All treatments were performed for 2 hours, from 28 to 30 hpf. hsp70:dn-Ras embryos were collected and fixed 2 hours following heat shock at 30 hpf. (A2-D2) Rosette formation was not disrupted when Ras-MAPK or Rock activity was blocked suboptimally. Pink arrowheads indicate the leading-most position in pLLp where pMRLC was detected. (E-F2) Combined suboptimal Rockout treatment with suboptimal MAPKK inhibition or suboptimal induction of hsp70:dn-Ras also resulted in failure of activation of MRLC in the leading edge and of formation of leading rosettes. (G) Quantification of pMRLC staining in the different treatment conditions. Percentages were derived by counting the number of cells caudal to the distalmost pMRLC signal (i.e. the number of leading cells that lacked the signal) and normalizing to the total number of cells in the pLLp. Suboptimal treatments or heat shock conditions did not cause a significant change in the pLLp position where MRLC is activated, but combinatorial treatments caused a significant difference (one-way ANOVA, P<0.0001; post-hoc Tukey-Kramer, **P<0.005). Scale bar: 20 μm. |