
- Title
-
Mechanism of pectoral fin outgrowth in zebrafish development
- Authors
- Yano, T., Abe, G., Yokoyama, H., Kawakami, K., and Tamura, K.
- Source
- Full text @ Development
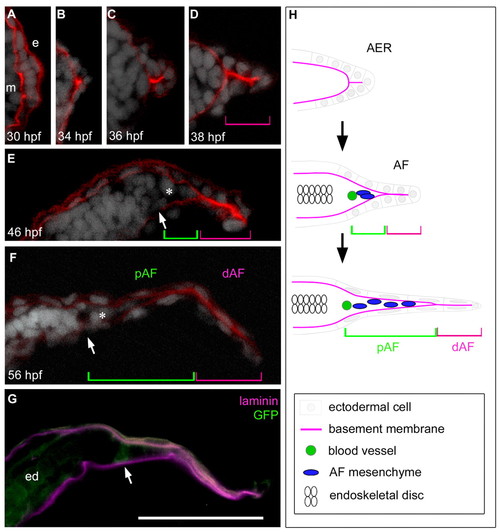
AER-AF transition and morphological features in pectoral fin development. (A-G) A series of transverse pectoral fin bud sections (distal is to the right and dorsal is to the top) at the indicated stages. The basement membrane (red), shown by Laminin α5 immunostaining, is located between the ectoderm (e) and mesoderm (m) (A). Cell nuclei are visualized by DAPI (white). The distal portion of the AF (magenta brackets) consists of ectodermal cells only, and mesenchymal cells (asterisks) enter the notch of the AF within the proximal AF region (green brackets). The circumferential fin blood vessel (white arrows) is located at the base of the AF (E-G), and is recognizable by GFP distribution in fli1:EGFP y1 transgenic fish (G). ed, endoskeletal disc. Scale bar: 50 μm. (H) Diagram of transverse fin bud sections during AER/AF morphogenesis. |

Pectoral fin outgrowth after the AER-AF transition. (A,B) fli1:EGFP y1 fish fin at 43 (A) and 48 (B) hpf, showing developing circumferential fin blood vessel (white arrows). (C) Schematic of a pectoral fin bud. ed, endoskeletal disc. (D-G) Whole-mount observation of pectoral fin bud outgrowth at the indicated stages. GFP (green) was distributed in the circumferential blood vessel (white arrow) and the endoskeletal disc (asterisk). White dots indicate the fin margin. (H) Temporal changes in AF and endoskeletal region lengths (see also supplementary material Table S1). Error bars indicate s.e.m. AF growth rate (ratio of AF length to total length of the pectoral fin) increased most rapidly until <60 hpf (data were analyzed by Student’s t-test; *P<0.05; **P<0.001). Scale bars: 100 μm. |
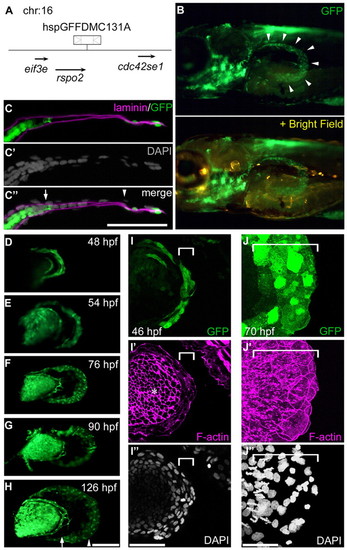
GFP distribution within the distal AF in the hspGFFDMC131A;UAS:GFP line. (A) The hspGFFDMC131A insertion is located 6.6 kb downstream of the R-spondin 2 (rspo2) gene on chromosome 16. (B) An hspGFFDMC131A embryo crossed with the UAS:GFP line. The panel is a lateral view of the pectoral fin bud at 76 hpf; the GFP-positive region is within the edge of the AF (arrowheads). (C-C3) One section of the pectoral fin at 76 hpf (B) processed for three-color immunostaining [C, GFP (green) and Laminin α5 (magenta); C2, DAPI (gray); C3, merged image]. Scale bar: 50 μm. Arrow and arrowhead indicate the fin blood vessel and pAF/dAF boundary, respectively. (D-H) Lateral view of the pectoral fin buds. Scale bar: 100 μm. Arrow indicates the fin blood vessel. Arrowhead indicates the pAF/dAF boundary. (I-J3) High-magnification views of dAF cells (white brackets) at 46 (I-I3) and 70 (J-J3) hpf. Asterisk indicates not the AF but the endoskeletal region. Scale bars: 50 μm. |
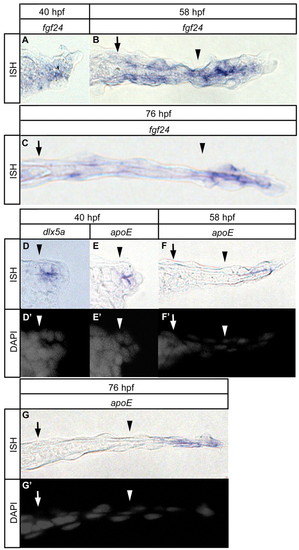
Spatiotemporal expression pattern of AER/AF marker genes. (A-G) Spatial change of expression domain of fgf24 (A-C), dlx5a (D) and apoE (E-G) at the indicated stages. D2-G2 show cell organization (gray: DAPI). Distal is to the right; dorsal is to the top in transverse sections. Arrows indicate circumferential fin blood vessel. Arrowheads indicate the base of the AF notch. |
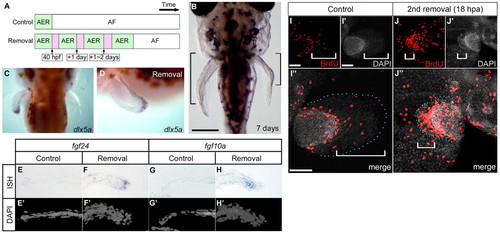
Repeated AF removal caused prolonged developmental gene expression and excessive elongation of the endoskeletal region. (A) Experimental strategy for continuous AER presence. Bars indicate pectoral fin development time scale (control and removal sides of the fin). (B) A sample (7 days post-fertilization) after AF removal was performed three times on the left side of the pectoral fin bud. Black brackets indicate the endoskeletal region. Scale bar: 200 μm. (C,D) Dorsal and lateral views: 12 hours after the third AF removal, dlx5a was expressed in the re-formed AER (left side). (E-H2) Expression pattern of fgf24 and fgf10a 12 hours after the third AF removal. Fgf24 was expressed in the regenerating AER, and fgf10a was expressed in the distal portion of the endoskeletal region (F,H). Distal is to the left on the control side (E,E2,G,G2) and to the right on the AF removal side (F,F2,H,H2). (I-J3) Distribution of BrdU-positive cells after formation of a new AER. Whereas there are BrdU-positive cells at the distal edge of the endoskeletal region in the control side of the fin (I), in the side in which the AF had been removed, BrdU-positive cells are mainly located in the re-formed AER/AF region (white brackets) and in the endoskeletal region (J). Distal is to the right on the control side (I-I3) and to the left side on the AF removal side (J-J3). Blue dots indicate the fin margin. Scale bars: 100 μm in I,J. |
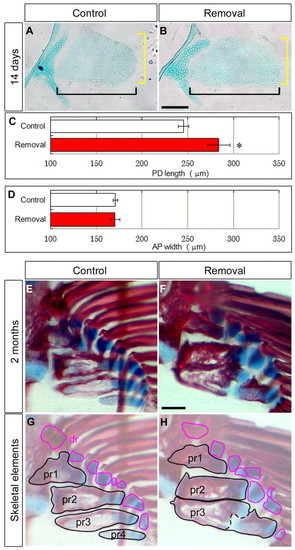
Repeated AF removal affected endoskeletal bones. (A,B) Alcian Blue staining of the pectoral fin 14 days after AF removal (three times). Scale bar: 100 μm. (C,D) PD length (C, black brackets in A,B) and AP width (D, yellow brackets in A,B) of endoskeletal disc after removing the AF three times. Error bars indicate s.e.m. Data were analyzed by Student’s t-test (*P<0.05). Measurements are shown in supplementary material Table S2. (E-H) Alcian Blue and Alizarin Red staining of the pectoral fin 2 months after AF removal. Specimens (E,F) are outlined and highlighted, focusing on endoskeletal bones (G,H). Proximal radials (pr) are outlined in black. Distal radials (dr) are outlined in red. Scale bar: 100 μm. |
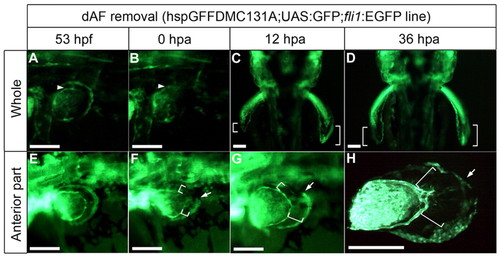
Distal AF removal affected AF outgrowth. The dAF is visualized in the hspGFFDMC131A;UAS:GFP line; the AF base is shown by fli1:EGFP (arrowheads). (A-C) When the dAF was completely removed from the left fin (B), pAF (GFP-negative) development was delayed compared with the control side (C) (n=3/3; white brackets). (D) By 36 hours post-amputation (hpa), the AF length (white brackets) had returned to normal. (E-G) When the anterior part of the dAF was removed (E,F), only the anterior pAF development was delayed (n=6/8; compare with white brackets in E,F). (H) By 36 hpa, the fin shape had returned to normal. Arrows represent the removed/unremoved boundary. The pectoral fin bud was dissected from the fish body and mounted on a glass slide. Scale bars: 200 μm in A,B,E-H; 20 μm in C,D. |
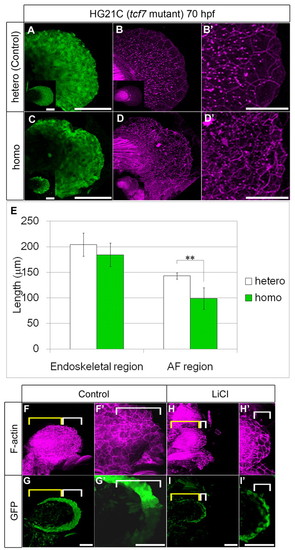
Disruption of cell shape caused AF shrinkage. (A-E) Heterozygotes for control (A,B) and homozygotes (C,D) of tcf7 mutants [HG21C line (Nagayoshi et al., 2008)]. The AF is shortened and wavy with abnormal shrunken cells (C,D). Insets (bottom left in A-D) show images of whole fin and high magnification of the cell shape is shown in B2,D2. (E) PD lengths of the endoskeletal region (left) and AF region (right) at 70 hpf in heterozygotes (n=12) and homozygotes (n=9). Measurements are shown in supplementary material Table S4. Data were analyzed by Student’s t-test (**P<0.001). Error bars indicate s.d. (F-I2) LiCl treatment. Cytoskeletal disruption of the AF was detected by immunostaining for F-actin (magenta) using the hspGFFDMC131A;UAS:GFP fish (green). About five rows of ectodermal cells (white brackets) were located in the control fin (0.3 M NaCl) (F,G, high magnification of the AF in F2,G2). The LiCl-treated fin had the same number of ectodermal rows as the control, but the cells were flattened along the PD axis (H,I, magnification of the AF in H2,I2). Note that the endoskeletal region (yellow brackets) was hardly affected in this experiment. Scale bars: 100 μm in A,C,F-I2 50 μm in B2,D2. |
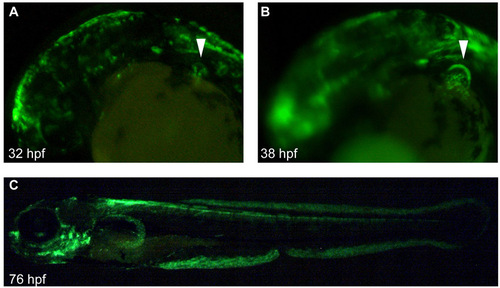
Distribution of gal4 reporter in the hspGFFDMC131A line. The hspGFFDMC131A line was crossed with the UAS:GFP line; Gal4 distribution is shown by GFP fluorescence. (A-C) Lateral view of embryos at 32 (A), 38 (B) and 76 (C) hpf. At 32 hpf, GFP was distributed in the epidermis, brain and AER (arrowhead in A). At 38 hpf, the AF was clearly visible by the GFP distribution (arrowhead in B). (C) At 76 hpf, GFP was distributed in several organs (brain, branchiae, spinal cord, AF and median fin fold). |
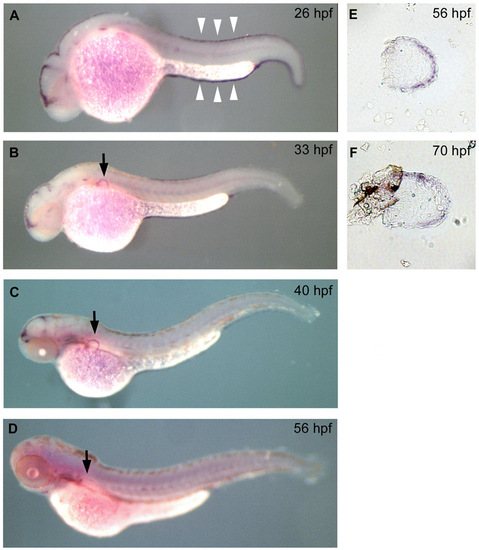
The mRNA expression of the rspo2 gene. (A-D) Whole-mount in situ hybridization for rspo2 (predicted R-spondin 2) antisense probe at the indicated stages. Consistent with the GFP distribution in hspGFFDMC131A embryos crossed with the UAS:GFP fish line, rspo2 mRNA was expressed in the MFF (white arrowheads) and the AF of the pectoral fin bud (black arrows); see also Fig. 3 and supplementary material Fig. S2. Anterior is to the left; dorsal is to the top. (E,F) Rspo2 expression in the pectoral fin bud at later developmental stages (56 hpf in E and 70 hpf in F) was located in the distal edge of the AF (dAF). Distal is to the right; anterior is to the top. |
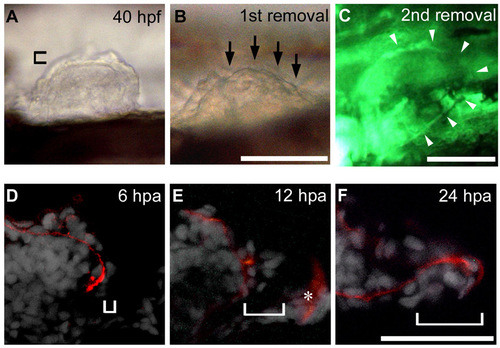
AER and AF epidermal reconstruction after AF removal. (A,B) First removal of the AF was done at 40 hpf. In this sample, the posterior two-thirds of the AF was removed (arrows in B). Note that the boundary between the remaining anterior AF and underlying endoskeletal region can be outlined, indicating that the endoskeletal region is intact after AF removal. (C) Circumferential blood vessel, which is visualized in fli1:EGFP y1 fish, after the second AF removal. As shown by white arrowheads, the entire vessel is intact. (D-F) Transverse sections immunostained for Laminin α5 (red) and DAPI (white). At 6 hours post-amputation (hpa), a layer of epidermis had regenerated (bracket in A). At 12 hpa, the AER structure had re-formed with a notch (bracket in B). Unwanted fluorescence in the trunk (asterisk) was observed in this panel. At 24 hpa, the AER had transformed into the AF structure with a long notch (bracket in C). Distal is to the right in all panels. Scale bars: 100 μm. |
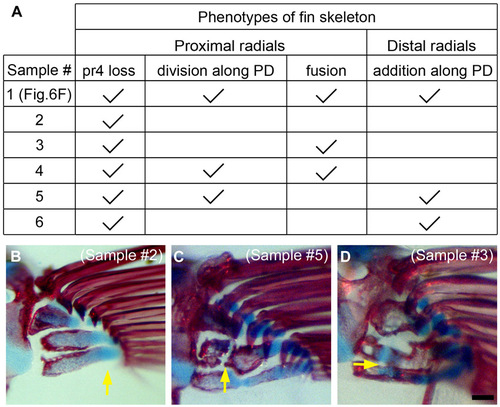
Phenotypes of fin skeleton after AF removal three times. (A) A table showing phenotype of radials in all six samples in which we observed a skeletal pattern. Sample 1 is the one that is shown in Fig. 6F. Phenotypes are categorized into proximal radials (loss, division, and fusion) and distal radials (addition). (B-D) Skeletal patterns in three other specimens are shown. At the points indicated by yellow arrows, pr (proximal radial) 4 is lost (B), pr2 is divided (C), or pr2 and pr3 are fused (D). |
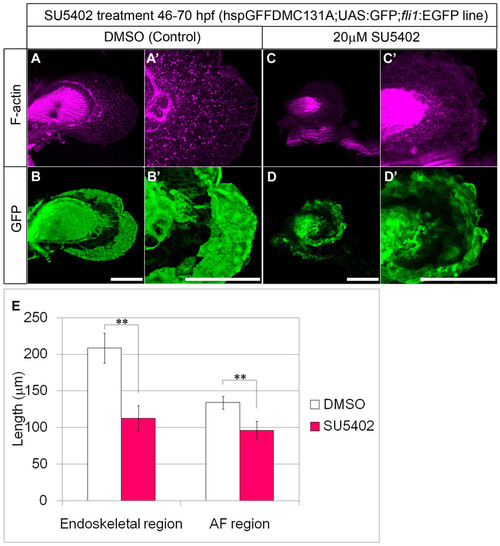
SU5402 treatment affects AF outgrowth. Inhibition of signaling through FGF receptors was performed with SU5402 (CalBiochem) as described previously (Abe et al., 2007). Embryos were incubated in 20 µM SU5402 (prepared from 4 mM stock solution in DMSO) containing fish water. Control embryos were incubated with the corresponding amount of DMSO. (A-D2) SU5402 inhibits both elongation of the AF and outgrowth of the endoskeletal region. hspGFFDMC131A;UAS:GFP line fish were treated with DMSO (A,B) or 20 μM SU5402 (C,D) for 24 hours. Cell shape was visualized by staining with F-actin (magenta) (A,C). (E) PD length of endoskeletal region (left) and the AF region (right) at 70 hpf after treatment with DMSO (n=12, white bars) or 20 μM SU5402 (n=11, red bars). Measurements are shown in supplementary material Table S3. Data were analyzed by Student’s t-test (**P<0.001). Error bars indicate s.d. Scale bars: 100 μm in A-D2. |
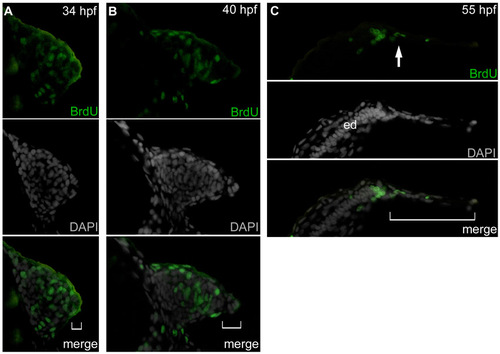
Cell proliferation in the pectoral fin bud. (A-C) BrdU-positive cells were not observed in the AER or AF (white brackets). BrdU-positive cells were mainly observed in the undifferentiated mesenchyme, in the distal periphery of the endoskeletal disc (ed), and in a few migrating mesenchymal cells (white arrow) at 34 (A), 40 (B) and 55 (C) hpf. All observations were repeated in more than eight samples, which yielded equivalent results. Upper, middle and bottom panels show immunostaining for BrdU (GFP), DAPI (gray) and merged images. |
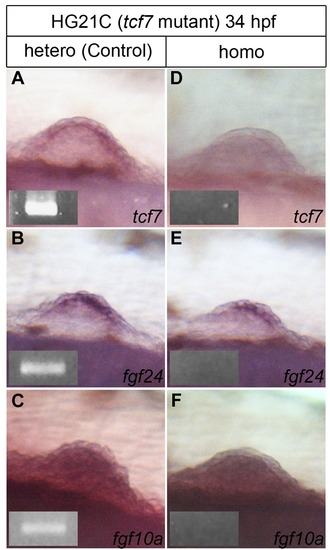
Pectoral fin formation in HG21C line (tcf7 mutant fish). (A-F) Whole-mount in situ hybridization of pectoral fin buds of heterozygous (control) and homozygous embryos. In heterozygous embryos at 34 hpf, fin buds were formed, and tcf7 (A) and fgf24 (B) were expressed in the AER/AF, and fgf10a (C) was expressed within the fin mesenchyme. In homozygous embryos of HG21C, tcf7 mRNA was not detected (D), but fin buds were formed normally with mRNA expression of fgf24 (E) and fgf10a (F). Genotype analyses of the HG21C mutant by genome PCR. In heterozygous embryos, 1119-bp fragments were detected (insets in A-C) but these were not in homozygous embryos (insets in D-F). |

LiCl treatment caused AF/MFF shrinkage. (A,B) Time-lapse observation of morphological change caused by LiCl treatment in the pectoral fin bud (A, 70 hpf) and the median fin fold (B, 42 hpf) using the hspGFFDMC131A;UAS:GFP fish line. (A) The fin bud (arrow) began to shrink, eventually reaching half of its original size (n=35/40). (B) The MFF was gradually influenced (magenta brackets), whereas LiCl treatment did not affect somite size (white brackets). (C,D) Cytoskeleton organization in the dorsal MFF (magenta bracket). The same effect was observed (control MFF in C; LiCl-treated MFF in D). Scale bars: 100 μm in A,B; 20 μm in C,D. Head is to the left and dorsal is to the top. |