- Title
-
Integration of telencephalic Wnt and hedgehog signaling center activities by Foxg1
- Authors
- Danesin, C., Peres, J.N., Johansson, M., Snowden, V., Cording, A., Papalopulu, N., and Houart, C.
- Source
- Full text @ Dev. Cell
|
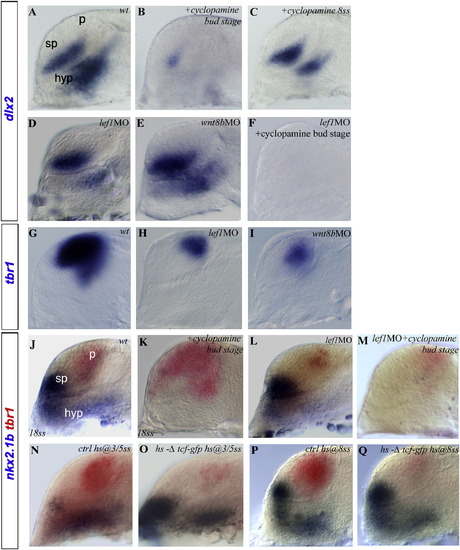
Shh and Wnt Signaling Activities Independently Regulate the Establishment of the Dorsoventral Axis in the Telencephalon(A–Q) Here, as in all subsequent panels, embryos are shown in lateral view, with anterior oriented toward the left and dorsal oriented toward the top unless stated otherwise. Treatments and/or MO injected in embryos are indicated in the top right corners. Embryos are at the 22ss, except when stated otherwise (bottom left of the picture). Expression of (A–F) dlx2 and (J–Q) nkx2.1b (blue) and of (G–I and J–Q) tbr1 (red and blue) in (A, G, J, N, and P) WT/control, cyclopamine-treated embryos at the (B and K) bud or the (C) 8ss, (D, H, and L) the lef1 morphant, the (E and I) wnt8b morphant, (F and M) lef1 morphants treated with cyclopamine at the bud stage, and hs-Δtcf-gfp transgenic embryos heat shocked at the (O) 3ss and the (Q) 8ss embryos. hyp, hypothalamus; sp, subpallium; p, pallium. |
|
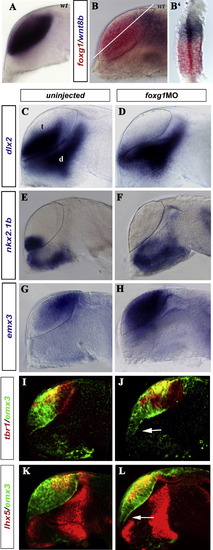
Foxg1 Is Required for the Development of Subpallial Progenitors and Restriction of Pallial Character(A–L) Here, and subsequently, embryos are prim-5 unless stated otherwise at the bottom left of the picture. (A–B′) foxg1 expression (blue in [A], red in [B] and [B′]) (A) alone or (B and B′) compared to wnt8b (blue). (B′) Transverse section along the DV axis (white line in [B]). (C–L) Gene expression (on the left of each row) in controls (left column) or in foxg1 morphants (right column). (I–L) GFP staining (green) in a Tg(emx3:YFP) line, coupled with (I and J) tbr1 or (K and L) lhx5 in red. The dotted line indicates the telencephalic border. The arrow in (J) and (L) indicates abnormal morphology of the baso-alar border. t, telencephalon; d, diencephalon. |
|
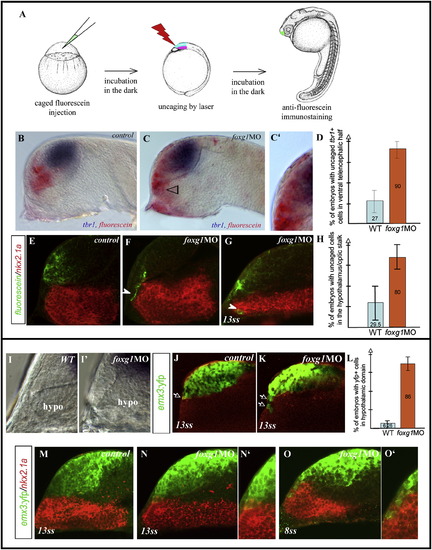
Prospective Subpallial Precursors Adopt the Pallial Fate or Move into Basal Territory in foxg1 Morphants(A–H) Uncaging experiments. (A) Schematic of the experimental procedure. The telencephalic anlage is indicated in bright blue, and the hypothalamus is indicated in pink. Fluorescein uncaged cells in (B and E) control or (C, F, and G) foxg1MO embryos are detected (in red in [B] and [C] or in green in [E]–[G]) in parallel to (B and C) tbr1 (blue) or (E–G) nkx2.1a (red, confocal sections). The quantification of fluorescein+ cells coexpressing tbr1 in the ventral telencephalon in control or foxg1 morphants with standard deviation is shown in (D). Fluorescein+ cells in the hypothalamus/optic stalk region (arrowheads) are quantified in (H).(I and I2) Close-up of the rostral forebrain by using Nomarski optic in (I) control and (I2) foxg1 morphant embryos.(J–O2) Confocal sections of (M–O′) Tg(emx3:YFP) with YFP in green and nkx2.1a in red, in (J and M) control, or (K, N, and O) foxg1MO embryos. (L) Quantification of YFP+ cells in the hypothalamic domain. |
|
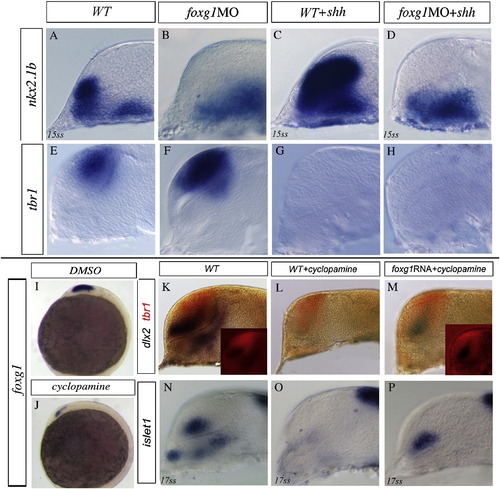
Foxg1 Functions Downstream of Shh Activity to Induce Subpallial Character(A–P) The markers analyzed are indicated on the left of each row. The identity of the embryos is indicated on top of each column. (A–H) Expression of (A–D) nkx2.1b and (E–H) tbr1 when shh is overexpressed in (C and G) WT or in (D and H) foxg1 morphants, compared to (A and E) WT or (B and F) foxg1 morphants. (I and J) Foxg1 expression in the (I) 5ss control or in (J) embryos treated with cyclopamine at bud stage. (K–P) Effects of cyclopamine treatment at the bud stage in (L and O) WT or (M and P) foxg1-overexpressing embryos on dlx2 and islet1 compared to (K and N) untreated WT. (K–M) Telencephalon is highlighted by tbr1 expression in red (insets). |
|
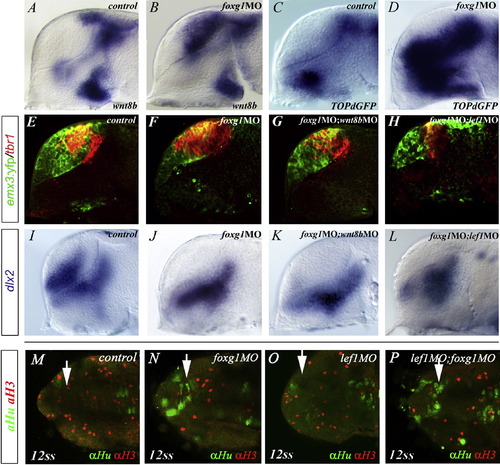
Upregulation of Wnt/β-Catenin Signaling Activity Controls the Expansion of Pallial Fates in foxg1 Morphants(A–L) (A and B) wnt8b and (C and D) topdGFP expression in (A and C) control or (B and D) foxg1MO embryos. Expression of tbr1 (red) and YFP (green) in (E–H) Tg(emx3:YFP) or (I–L) dlx2 , in embryos injected with (F and J) foxg1MO alone or in (G and K) combination with wnt8bMO or (H and L) lef1MO.(M–P) Dorsal views (anterior is oriented toward the left) showing confocal images of double immunostaining of the mitotic marker phosphorylated H3 (red) and the postmitotic neuronal marker HuC (green) in (M) WT, (N) foxg1MO, (O) lef1MO, or (P) foxg1MO;lef1MO double morphants. |
|
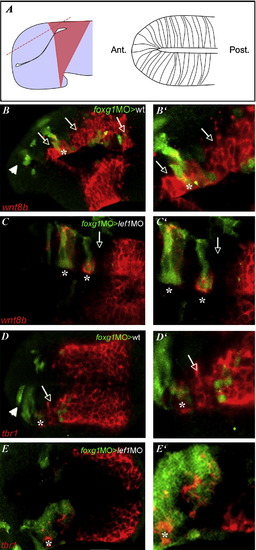
Foxg1 Loss of Function Acts Cell Autonomously and Nonautonomously for the Restriction of Pallial Identity(A–E′) All embryos are at the 20ss. All panels show telencephalic dorsal views; anterior is oriented toward the left. The right column shows high magnification of the images on the left. (A) Schematic explaining the plan of section of the confocal images below. The normal wnt8b expression domain is pale red. (B–E) Confocal images of mosaic embryos with transplanted foxg1MO cells in green and (B–C′) wnt8b or (D–E′) tbr1 expression in red. Asterisks indicate foxg1MO cells, and arrows show neighboring host cells. Host embryos are (B, B′, D, and D′) WT or (C, C′, E, and E′) lef1 morphants. The arrowhead in (B) and (D) indicates the foxg1MO cells located in the ventral telencephalon. |
|
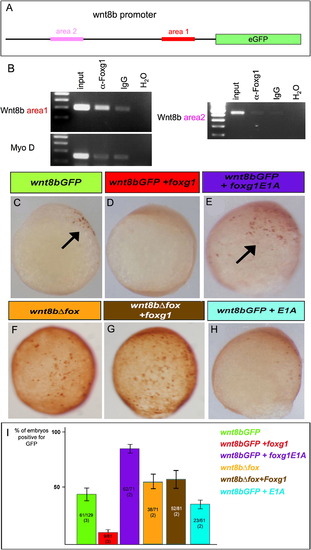
Foxg1 Binds to the wnt8b Promoter and Represses Its Transcription(A) Schematic of the wnt8b promoter sequence cloned and used for the transgenic construct (see Figure S6).(B) PCR results of the ChIP assay. The Foxg1 ChIP shows a specific enrichment of the area 1 band of the wnt8b promoter (see Figure S6) compared to MyoD (negative control) or area 2 and significantly higher enrichment than in the IgG ChIP (background control).(C–H) Lateral views (anterior is oriented toward the top of the bud-stage embryos) showing cells expressing GFP (brown), under the control of the wnt8b promoter described in (A) and in Figure S6. (C–E and H) Wnt8b1.4:GFP DNA or (F and G) wnt8b1.4ΔFox:GFP injected either (C and F) alone or with (D and G) Foxg1, (E) FoxG1-E1A, or (H) E1A transcripts.(I) Quantification of embryos showing GFP expression. The numbers shown are the sum of two independent experiments with standard deviation. |
|
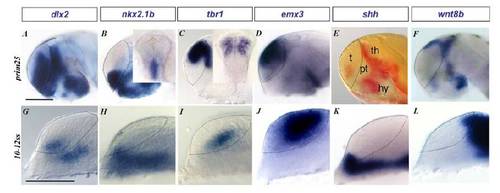
Pallial and Subpallial Domains Are Detectable from Mid-Somite Stage in Zebrafish |
|
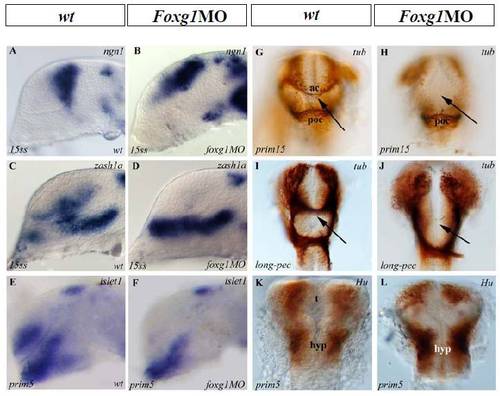
Neuronal Differentiation Is Affected in the Telencephalon of foxg1 Morphant |
|
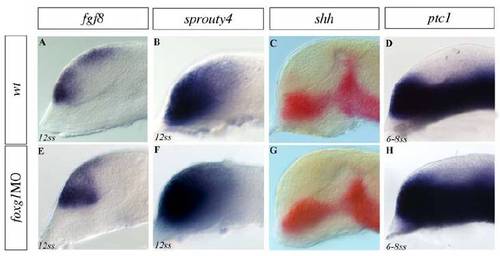
Fgf and Shh Signaling Activities in foxg1 Morphants |
|
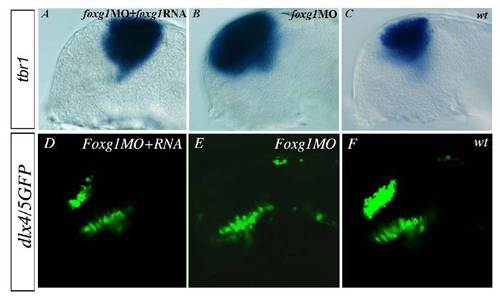
foxg1 RNA Injection Rescues foxg1 Morphant Phenotype |
Reprinted from Developmental Cell, 16(4), Danesin, C., Peres, J.N., Johansson, M., Snowden, V., Cording, A., Papalopulu, N., and Houart, C., Integration of telencephalic Wnt and hedgehog signaling center activities by Foxg1, 576-587, Copyright (2009) with permission from Elsevier. Full text @ Dev. Cell

