
- Title
-
BCDO2 acts as a carotenoid scavenger and gatekeeper for the mitochondrial apoptotic pathway
- Authors
- Lobo, G.P., Isken, A., Hoff, S., Babino, D., and von Lintig, J.
- Source
- Full text @ Development
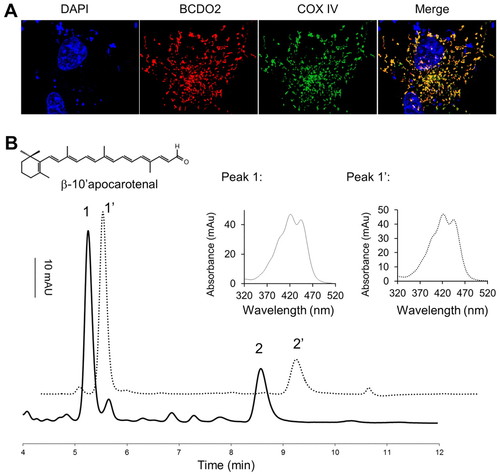
Subcellular localization and biochemical properties of zebrafish BCDO2. (A) COS7 cells expressing recombinant zebrafish BCDO2 with a V5 tag. Immunostaining was performed using anti-V5 antibody for BCDO2 (red) and mitochondria-specific anti-COXIV antibody (green). Merged image (right-most panel) shows mitochondrial colocalization of BCDO2 with COXIV. Images are taken at 63× magnification. (B) Recombinant zebrafish BCDO2 was expressed in an E. coli strain capable of synthesizing BC. Carotenoids and putative carotenoid-cleavage products were extracted and subjected to HPLC analysis. The solid line shows a HPLC profile at 420 nm of the E. coli lipid extract. Two major peaks (1 and 2) became detectable. These peaks showed similar retention times and spectral characteristics (insets) as the β-10′-apocarotenal oxime (syn and anti) standards (peaks 1′ and 2′) (dotted line). The insets give spectral characteristics of peak 1 and peak 1′. |
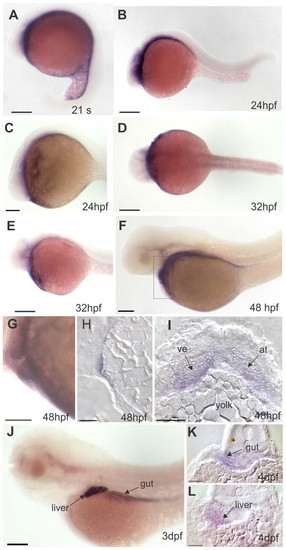
Expression patterns of bcdo2 during zebrafish development. (A-C,E-G,K) Lateral views, anterior is leftwards. (D) Dorsal view (anterior is leftwards; (H) sagittal section; (I,K,L) transverse cross-sections. (A) During late segmentation stages, bcdo2 is expressed in ventral cell layers. (B-E) At 24 to 32 hpf, bcdo2 expression is found in anterior parts adjacent to the yolk. (F,G) At 48 hpf, bcdo2 is expressed in cardiac and pericardial cells, as well as in endodermal tissues. In G, a higher magnification of the developing heart is shown. (H,I) Sagittal and transverse cross-sections though the cardiac region reveal expression of bcdo2 both in the atrium and the ventricle. (J) At early larval stages, bcdo2 is expressed in cells of the (K) gut and (L) liver. Scale bars: 100 μm in A-D,G,J; 50 μm in E,F,H,I,K,L. at, atrium; ve, ventricle. EXPRESSION / LABELING:
|
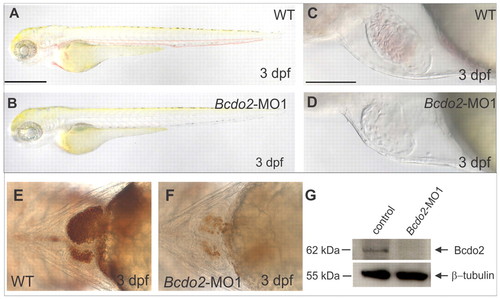
Targeted knockdown of BCDO2 causes anemia in zebrafish embryos. (A-D) Lateral views of 3 dpf larvae; (A-D) bcdo2 morphants show reduced red coloring of blood. (E,F) Views of the heart of a control (E) and a bcdo2 morphant (F) stained for hemoglobin. (G) Immunoblot analysis for BCDO2 with protein extracts of 2 dpf control and morphant larvae (n=5 embryos per lane). WT, wild type. Scale bars: 500 μm in A,B; 100 μm in C,D. EXPRESSION / LABELING:
PHENOTYPE:
|

Characterization of the blood phenotype in bcdo2 morphant zebrafish larvae. (A,B) Dorsal views, anterior is upwards. (C-N,Q,R) Lateral views. Anterior is towards the left. (A-F) Whole-mount in situ hybridization for mRNA expression patterns of gata1 and gata2 are similar in morphants and controls. (G-L) o-Dianisidine staining for hemoglobin at different developmental stages of control and Bcdo2 morphant embryos. In 3 dpf bcdo2 morphants (J), staining is reduced when compared with controls (I). (M,N) Staining for hemoglobin (hbae3) mRNA reveals no differences between 2 dpf bcdo2 morphants and controls. (O,P) Blood smears from 3 dpf bcdo2 morphants and control larvae. Blood cells of bcdo2 morphants show fragmented nuclei. (Q,R) TUNEL staining reveals that blood cells of 2 dpf bcdo2 morphants undergo apoptosis. Scale bars: 100 μm in A-F,M,N,Q,R; 250 μm in G-L; 10 μm in O,P. Whole-mount in situ hybridization experiments were conducted with 30 embryos for each condition. o-Dianisidine staining for hemoglobin in morphant and control siblings was conducted with 50 fish per experiment. The experiment was repeated six times with essentially the same outcome. EXPRESSION / LABELING:
|
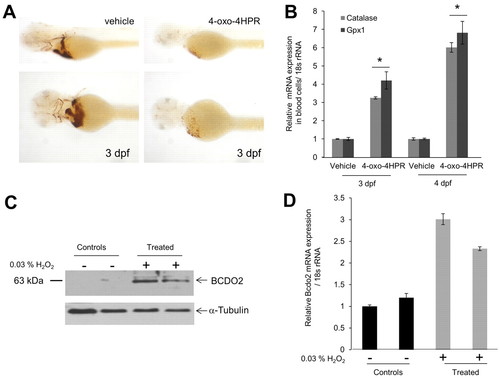
4-oxo-fenretinide (4-oxo-4HPR) induces apoptosis of blood cells and oxidative stress in zebrafish larvae. All embryos were raised in the presence of 200 μM 1-phenyl-2-thiourea (PTU) to inhibit pigmentation at 28°C. Two days post-fertilization, embryos (n=50 for each condition and experiment) were manually dechorionized and incubated in egg water containing 1 μM 4-oxo-fenretinide (4-oxo-4HPR) or vehicle only [0.1% (v/v) DMSO]. (A) After 24 hours, hemoglobin staining was performed using the o-Dianisidine dye. Representative images were taken under a Leica stereo microscope at 1.6× (top panels) and 4.0× (bottom panels) magnifications. (B) RNA from isolated blood cells was assessed for glutathione peroxidase 1 (gpx1) and catalase mRNA expression. The 18s rRNA probe set was used as the endogenous control. *P<0.05 compared with controls. Data are mean±s.e.m. (C,D) Larvae (2 dpf) were incubated in the presence or absence of 0.03% hydrogen peroxide (H2O2) for 24 hours. (C) Protein extracts from 12 larvae per lane were subjected to immunoblot analysis for BCDO2. α-Tubulin was used as protein loading control. (D) Total RNA was isolated from 12 larvae and bcdo2 expression was determined by qRT-PCR. Data are mean±s.e.m. |
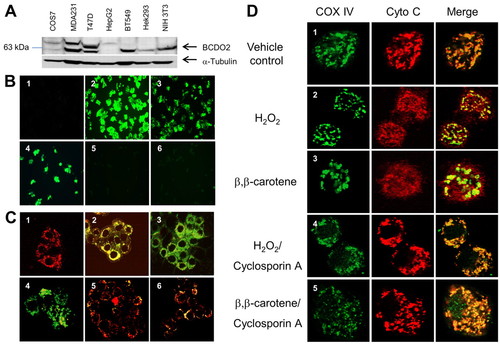
Carotenoids induce mitochondrial oxidative stress and trigger cytochrome c release in a BCDO2-dependent manner. (A) Immunoblot analysis for BCDO2 protein expression in various human cell lines. Note that the BCDO2 antiserum detects an additional protein with higher molecular weight in some cell lines. (B) HepG2 cells (panels 1-3) were incubated in the presence of vehicle (panel 1), 1 μM BC (panel 2) and 1 μM canthaxanthin (panel 3). T47D cells (panels 4-6) were incubated in the presence of t-butyl hydroperoxide (panel 4), 1 μM BC (panel 5) and 1 μM canthaxanthin (panel 6). After a 2-hour incubation, the non-fluorescent carboxy-H2DCFDA dye was added, which (in the presence of reactive oxygen species) emits bright green fluorescence. Data were obtained from three independent experiments. Representative images were obtained with a fluorescence microscope at 20× magnification. (C) HepG2 cells (panels 1-3) were incubated in the presence of vehicle (panel 1), 1 μM BC (panel 2) and 1 μM canthaxanthin (panel 3). T47D cells (panels 4-6) were incubated in the presence of the membrane-depolarizing agent carbonylcyanide-m-chlorophenylhydrazone (panel 4), 1 μM BC (panel 5) and 1 μM canthaxanthin (panel 6). After a 2-hour incubation, the mitochondrial membrane potential was assessed by JC-1 staining. Red fluorescence of JC-1 aggregates is indicative of intact mitochondria (panel 1) and green fluorescence of JC-1 monomers dispersed in the cytoplasm indicates mitochondria with depolarized membrane potentials (panel 4). Data were obtained from three independent experiments. Representative images were taken under a confocal microscope at 20× magnification. (D) HepG2 cells (rows 1-5) were incubated in the presence of vehicle (row 1), 0.03% hydrogen peroxide (H2O2) (rows 2 and 4) and 1 μM BC (rows 3 and 5). Cells in panels 4 and 5 were pre-treated with cyclosporine A. Localization of cytochrome c and the mitochondrial marker protein COXIV was determined by confocal microscopy upon immunostaining at 63× magnification. Cytochrome c, red fluorescence; COXIV, green fluorescence; colocalization of cytochrome c and COXIV, yellow to orange fluorescence. |
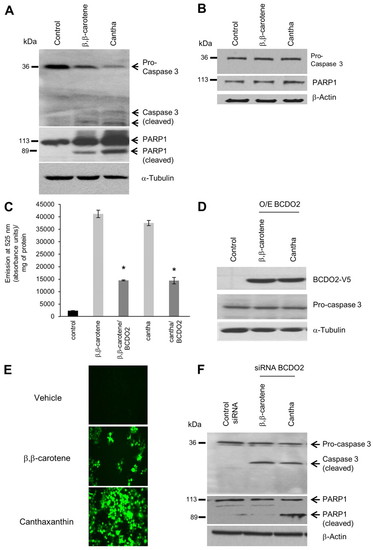
BCDO2 determines susceptibility of cells to apoptosis induction by carotenoids. (A,B) HepG2 (A) and T47D (B) cells were incubated in the presence of vehicle, 1 μM BC and 1 μM canthaxanthin. After 2 hours, cells were harvested and protein extracts were subjected to immunoblot analysis using caspase 3 and PARP1 antiserum. (C,D) BCDO2 was expressed as a recombinant protein in HepG2 cells. At 40 hours post transfection, HepG2 cells were incubated in the presence of vehicle, 1 μM BC and 1 μM canthaxanthin, respectively. (C) After 2 hours, the non-fluorescent carboxy-H2DCFDA was added and fluorescence was quantified by emission of light at 525 nm and measured in absorbance units per milligram of protein. Assays were performed in duplicate and repeated three times. *P<0.05. Data are mean±s.e.m. (D) After 2 hours, cells were harvested and protein extracts were subjected to immunoblot analysis using caspase 3 and PARP1 antiserum. (E,F) T47D transfected with siRNA against bcdo2 were incubated in the presence of vehicle, 1 μM BC and 1 μM canthaxanthin. (E) After 2 hours, the H2DFCDA dye was added. Representative images were obtained with a Leica MM AF fluorescence microscope at 20× magnification. (F) After 2 hours, cells were harvested and protein extracts were subjected to immunoblot analysis using caspase 3 and PARP1 antiserum. β-Actin or α-tubulin were used as the protein loading control. Representative immunoblots are shown. |
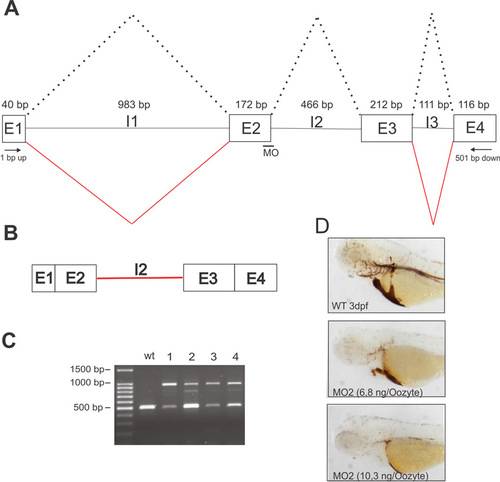
Characterization of Bcdo2-morphants generated with Bcdo2-MO2. (A) Scheme of the region of the Bcdo2 gene to which Bcdo2-MO2 was directed. The wild-type splice variant of the Bcdo2 mRNA is indicated by dotted lanes. The positions of the primers used for RT-PCR analysis are indicated in the figure. E, exon; I, intron. (B) Scheme of Bcdo2 mRNA with un-spliced intron 2. (C) Agarose gel electrophoresis of RT-PCR products for Bcdo2 generated from total RNA preparation of 3 dpf wild-type and four individual Bcdo2-MO2-treated larvae. (D) Representative lateral views of o-Dianisidine-stained 3 dpf wild-type and morphant larvae treated with different amounts of Bcdo2-MO2. PHENOTYPE:
|
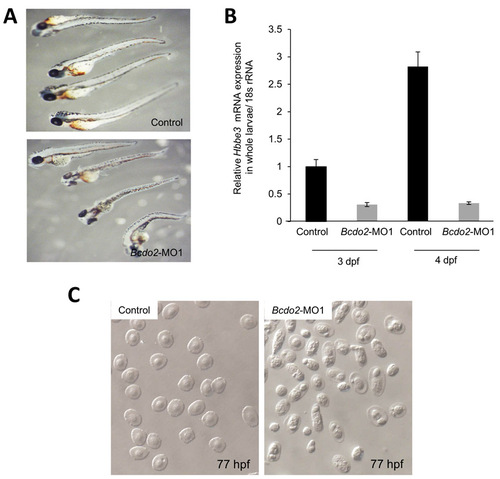
Blood phenotype of Bcdo2-MO1 morphants raised in the absence of PTU. (A) 3 dpf Bcdo2 morphant and control embryos (n=40 each) were stained for hemoglobin with o-Dianisidine as outlined in the Materials and methods. (B) Post Bcdo2-MO1 injection, 2-4 dpf larvae (n=50) were harvested and processed for total RNA as outlined in the Materials and methods. β-Globin (hbbe3) mRNA expression in Bcdo2 morphants was assessed using quantitative real-time RT-PCR, and compared with those of controls, harvested at the indicated time points. All larvae were raised in the absence of PTU. (C) Photographs of blood smears from 77 hpf control and Bcdo2-MO1 morphant fish raised in the absence of PTU. |
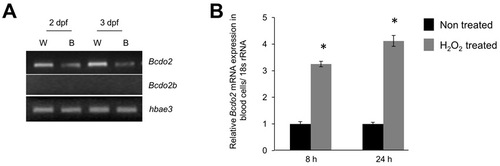
Bcdo2 is expressed as a oxidative stress-inducible gene in blood cells. (A) RT-PCR analysis for Bcdo2 (annotated as Bcdo2-l: NM_131799) and Bcdo2b (NM_001040312) in 2 and 3 dpf whole fish (W) and isolated blood cells (B). For blood isolation embryos were treated with tricaine (0.168 mg/ml tricaine) and blood cells from 35 fish were isolated in 1×PBS. Isolated blood cells were collected by centrifugation (1000 rpm for 3 minutes at 4°C). RNA was then isolated using Trizol reagent (Invitrogen) using the protocol outlined by the manufacturer. Total cDNA was synthesized from 1 μg of total RNA using the RNA-to-cDNA kit from Applied Biosystems. PCR was carried out in a final volume of 50 μl containing 25 ng DNA, 20 pmol each primer, 0.2 mM dNTPs, 1.5 mM MgCl2, 50 mM KC1, 10 mM Tris-HCl (pH 9.0) and 0.5 U Taq polymerase (Roche). An initial denaturation step (95°C, 5 minutes) was followed by 28 cycles of denaturation (95°C, 30 seconds), primer annealing (55°C, 30 seconds) and extension (72°C, 45 seconds). PCR was ended with a final extension (72°C, 10 minutes) step. An aliquot of each PCR product was analyzed on 2% agarose gels to check the mRNA expression of each Bcdo2 form. Primers used for amplification were Bcdo2fwd (5′- TCCCGGATCCCATCACTA-3′) with Bcdo2rev (5′- TTTTTGGGATCTGAAAGC-3′); Bcdo2b-fwd (5′- CCCCAGAGCCCATTACGA -3′) with Bcdo2b-rev (5′-TTTCAAGTGTTTCTGGATC-3′). The hemoglobin alpha embryonic 3 (hbae3) primer pair hbae3-fwd (5′-gccttctttgacaaggttgc-3′) with hbae3-rev (5′-gtcagcaaacctcccttcag-3′) was used as loading control. (B) 2 dpf zebrafish larvae were raised in egg water and subjected to treatment with 0.03% H2O2. Eight and 24 hours post treatment, RNA from blood cells was isolated. RNA from isolated blood cells was assessed for Bcdo2 mRNA expression by qRT-PCR analysis. The 18s rRNA probe set was used as the endogenous control. *P<0.05 compared with non-treated. EXPRESSION / LABELING:
|
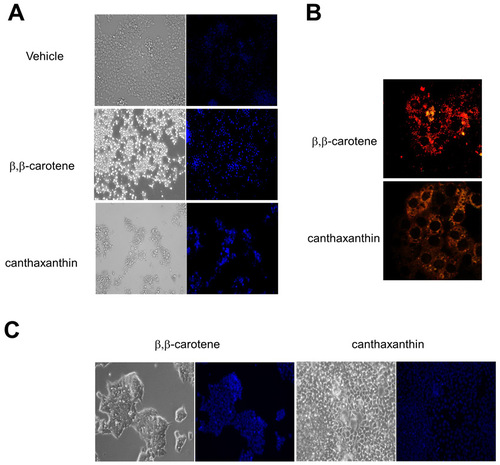
Effects of recombinant Bcdo2 expression in HepG2 and siRNA knockdown of Bcdo2 in T47D cells. (A) HepG2 cells were incubated in the presence of vehicle, 1 μM β,β-carotene and 1 µM canthaxanthin, respectively. After incubation with Hoechst 33342 dye, cells were examined for chromatin condensation under a fluorescence microscopic system at 20× magnification. (B) BCDO2 was expressed as a recombinant protein in HepG2 cells. Forty to 48 hours post transfection, cells were incubated in the presence of 1 μM β,β-carotene and 1 μM canthaxanthin, respectively. After 2 hours, the mitochondrial membrane potential was assessed by using the JC-1 stain. Cells were imaged at 20× magnification under a confocal microscope. Red fluorescence of JC-1 aggregates is indicative for intact mitochondria. Green fluorescence of JC-1 monomers dispersed in the cytoplasm indicates mitochondria with depolarized membrane potentials. (C) T47D cells were pre-treated with siRNA specific to human Bcdo2 for 72 hours. Then, cells were incubated with 1 μM β,β-carotene or 1 7mu;M canthaxanthin. After incubation with Hoechst 33342 dye, cells were examined for chromatin condensation under a fluorescence microscopic system at 20× magnification |
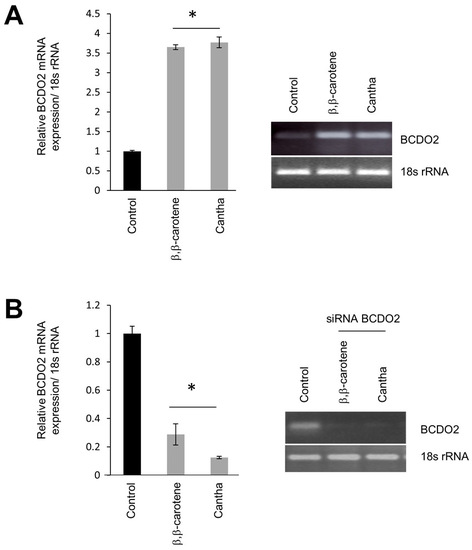
Bcdo2 mRNA expression in T47D cells. (A) T47D cells were incubated in the presence of vehicle only (0.1% v/v DMSO and 0.1% v/v THF), 1 μM of either β,β-carotene or canthaxanthin for 2 hours at 37°C and 5% CO2. (B) Alternatively, T47D cells were pre-treated with siRNA specific to human BCDO2 for 72 hours as outlined in the Materials and methods. Cells were then incubated in the presence of vehicle or carotenoids as described in A. Cells were harvested in 1×PBS and total RNA was isolated. Bcdo2 mRNA expression was evaluated by quantitative real-time RT-PCR using a Bcdo2 gene-specific probe set. The 18s rRNA probe set was used as the endogenous control. Post PCR products were electrophoresed on 2% (w/v) agarose gels and visualized by ethidium bromide staining. *P<0.05 compared with controls. |
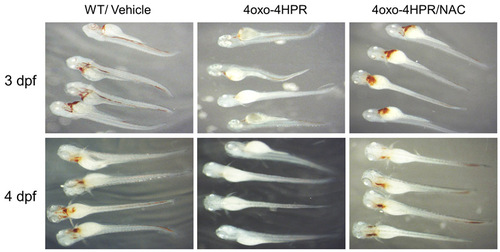
The antioxidant N-acetyl-L-cysteine can alleviate the blood phenotype of 4-oxo-4HPR-treated zebrafish embryos. 2 dpf zebrafish (n=35 per condition) raised in the presence of PTU were manually de-chorionized and treated with 1 7mu;M 4-oxo-4HPR alone or in the presence of 5 mM N-acetyl-l-cysteine (NAC). Vehicle only-treated larvae (WT/Vehicle) served as controls. Upon treatment, 3 dpf (upper panels) and 4 dpf (lower panel) fish were collected and stained for hemoglobin using o-Dianisidine as outlined in the Materials and methods. |