
- Title
-
Attenuation of notch and hedgehog signaling is required for fate specification in the spinal cord
- Authors
- Huang, P., Xiong, F., Megason, S.G., and Schier, A.F.
- Source
- Full text @ PLoS Genet.
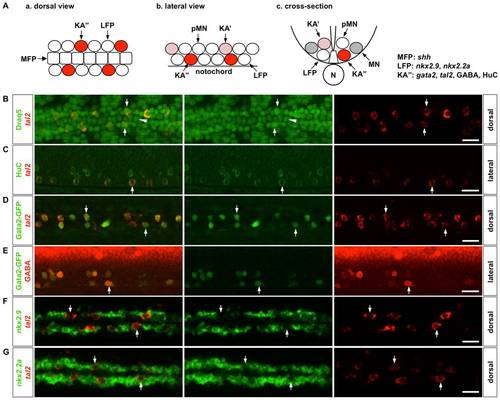
Marker analysis of the LFP domain. (A) Schematic drawings of the zebrafish ventral spinal cord at 24 hpf in a dorsal view (a), lateral view (b), and cross-section (c). The lateral floor plate domain, consisting of LFP cells and KA3 interneurons, flanks the medial floor plate (MFP). The motor neuron domain locates dorsal to the LFP domain, which contains motor neuron progenitors (pMN), motor neurons (MN), and Kolmer-Agduhr′ interneurons (KA′). KA interneurons, including KA′ and KA′′ cells, represent a unique class of GABAergic interneurons that are in contact with the cerebrospinal fluid and are implicated in regulating the swimming behavior in zebrafish [35], [47], [48]. Marker expression in MFP, LFP and KA3 cells are indicated on the right. N: notochord. (B) KA′′ cells, labeled by tal2 expression (arrows, red), are discontinuously distributed flanking the medial floor plate (arrowhead) along the anterior-posterior axis. Cell nuclei were labeled by Draq5 staining (green). (C) All tal2-positive cells (arrows, red) in the LFP domain also express pan-neuronal marker HuC (green). (D–E) All GFP-expressing cells in the LFP region (arrows, green) in Gata2-GFP fish also co-express tal2 (D, red) and GABA (E, red). (F–G) Wild type embryos were co-labeled with nkx2.9 (F, green) or nkx2.2a (G, green) together with tal2 (red). tal2-expressing KA′′ cells (arrows) show lower expression of nkx2.9 and nkx2.2a compared to their neighboring cells. Embryos shown are at 21 hpf (B), 30 hpf (C), 25 hpf (D), 27 hpf (E), and 18 hpf (F, G). B, D, F, and G show dorsal views, and C and E represent lateral views. Scale bars: 20 μm. |
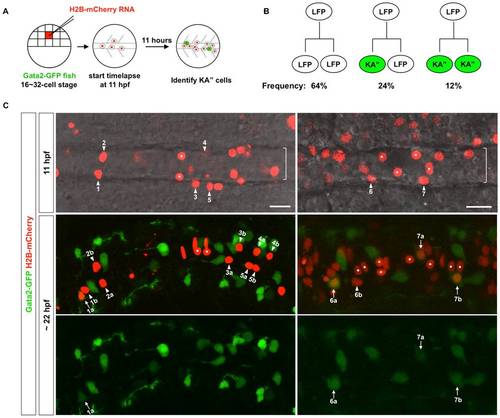
Lineage analysis of the LFP domain. (A) Schematic drawings of scatter labeling and time-lapse imaging. Gata2-GFP fish were injected with H2B-mCherry mRNA (red) into a single blastomere at 16- to 32-cell stage. Scatter labeled embryos with nuclear mCherry expression (red) were imaged in the dorsal view starting at 3-somite stage (11 hpf) for about 11 hours. At the end of the time-lapse, an image with both the green and red channels was acquired to identify Gata2-GFP-expressing KA′′ cells (green). (B) Observed division patterns in the LFP domain. Of a total of 25 cell divisions tracked, 16 were LFP/LFP divisions, 6 were KA′′/LFP divisions, and 3 were KA′′/KA′′ divisions. KA′′ cells (green) were identified base on the expression of Gata2-GFP reporter. (C) Gata2-GFP fish (green) was scatter labeled by H2B-mCherry (red) and imaged from 11 hpf for about 11 hours. Two examples are shown. Top panel: merged images with both the red channel and the bright field of a single optical slice at the start of the movie at 11 hpf. The underlying notochord (brackets) is visible but out of focus. Middle and bottom panels: the merged image with both green and red channels and the green channel alone of a confocal projection at the end of the movie around 22 hpf. KA′′ cells (arrows) can be distinguished from LFP cells (arrowheads) based on the expression of Gata2-GFP (green) at 22 hpf. Medial floor plate cells are indicated by white dots. Lineage related cells confirmed by cell tracking are indicated (also see Figure S1 and Video S1). For example, cell 1 generates a KA′′ cell (cell 1a) and an LFP cell (cell 1b). Of the 7 examples shown here, cells 1 and 6 undergo KA′′/LFP divisions, cell 7 undergoes KA′′/KA′′ division, and cells 2–5 divide symmetrically giving rise to two LFP cells (LFP/LFP divisions). Note that cells 4 and 6 are more dorsally located and therefore not in focus in images at 11 hpf (top panels). Scale bars: 20 μm. |
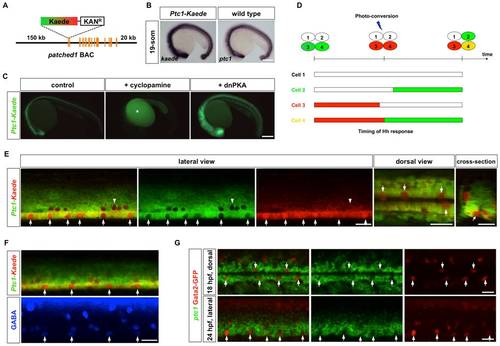
Temporal profiles of Hh response visualized by a Ptc1-Kaede reporter. (A) Schematic drawing of the Ptc1-Kaede BAC reporter. A cassette containing Kaede and Kanamycin resistant gene was recombined to replace the first exon of ptc1. (B) Ptc1-Kaede fish showed kaede expression in a pattern similar to the expression of ptc1 in wild type embryos at 19-som stage. (C) Inhibition of Hh signaling using cyclopamine blocked Ptc1-Kaede expression, while overexpression of dnPKA mRNA induced ectopic expression of the transgene. Fluorescent signal in cyclopamine-treated fish is due to auto-fluorescence of the yolk (asterisk). (D) Schematic drawings of PHRESH analysis. Photoconversion of the Ptc1-Kaede reporter can be used to determine the timing of Hh response (see text for details). (E) Ptc1-Kaede fish were photoconverted at 25 hpf, and imaged at 36 hpf. Single optical sections of a lateral view, dorsal view, and cross-section are shown. Arrows indicate Ptc1-Kaedered cells in the lateral floor domain. Note that dorsally located KA2 cells also only express Ptc1-Kaedered (arrowheads). (F) Ptc1-Kaede fish were photoconverted at 24 hpf, and stained with the GABA antibody (blue) at 35 hpf. Arrows indicate GABA-positive KA3 cells. (G) Gata2-GFP fish were co-labeled with ptc1 (green), and the GFP antibody (red). Images shown are the dorsal view of an 18 hpf embryo (top) and the lateral view of a 24 hpf embryo (bottom). KA′′ cells are indicated by arrows. Scale bars: 200 μm in B–C and 20 μm in E–G. |
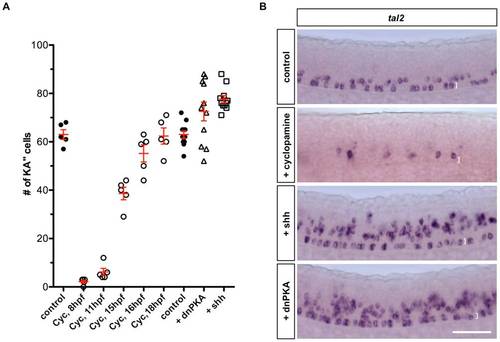
KA′′ specification depends on Hh signaling. (A) Quantification of the total number of KA′′ cells at 24 hpf under different conditions. Cyclopamine (Cyc) was treated from indicated stage until 24 hpf. Embryos injected with dnPKA or Shh mRNA showed increase in total number of KA′′ cells compared to uninjected control embryos. (B) Cyclopamine-treated embryos (from 8 hpf to 24 hpf) abolished tal2 expression in the LFP domain, while overexpression of dnPKA and Shh induced ectopic tal2+ cells. Note that the few tal2+ cells in cyclopamine-treated embryos are located dorsal to the LFP domain. Images shown are lateral views of embryos at 24 hpf. The dorsal-ventral extent of the LFP domain is indicated by brackets. Scale bar: 50 μm. |
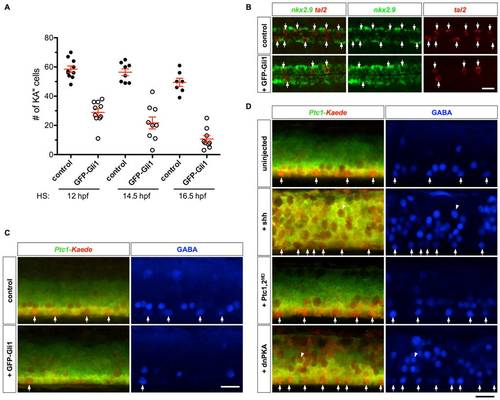
Prolonged Hh response interferes with KA′′ specification. (A) Quantification of KA3 specification in embryos overexpressing GFP-Gli1. hsp-GFP-Gli1 embryos and their non-transgenic sibling controls were heat-shocked at indicated stages, and stained at 25 hpf for the expression of tal2. (B) hsp-GFP-Gli1 and control embryos were heat-shocked at 14 hpf, and stained at 24 hpf for the expression of tal2 and nkx2.9. Induction of GFP-Gli1 results in a reduction of tal2-positive KA′′ cells (arrows) and expansion of nkx2.9-expressing LFPs. (C) Ptc1-Kaede control embryos, and Ptc1-Kaede; hsp-GFP-Gli1 embryos were heat-shocked at 14 hpf, photoconverted at 24 hpf, and stained with the GABA antibody (blue) at 36 hpf. Induced expression of GFP-Gli1 results in a reduction of KA′′ cells (arrows). Note that at 36 hpf, GFP-Gli1 expression has minimal contribution to the green fluorescence. (D) Ptc1-Kaede control embryos, and Ptc1-Kaede embryos injected with Shh mRNA, Ptc1 and Ptc2 morpholinos, or dnPKA mRNA were photoconverted at 24 hpf, and stained with the GABA antibody (blue) at 36 hpf. Arrows indicated GABA-positive cells in the LFP domain. Note that Shh and dnPKA overexpression induced many ectopic GABAergic neurons (arrowheads) throughout the dorsal-ventral axis of the spinal cord, and most of them appeared to lose Hh response by 24 hpf as indicated by the expression of Ptc1-Kaedered. Scale bars: 20 μm. |
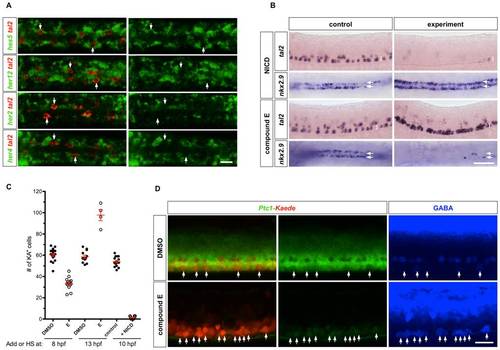
Notch signaling in KA′′ specification. (A) Wild type embryos at 18 hpf were double labeled with tal2 (red) and hes5, her12, her2, or her4 (green). tal2-expressing KA′′ cells (arrows) lack expression of hes5, her12, her2, or her4. Note that hes5, her12, her2, and her4 are expressed in only a subset of LFP cells, which might reflect the oscillating nature of these genes in neural progenitor cells as previously reported [49]. Dorsal views are shown. (B) hsp-Gal4; UAS-NICD embryos and non-transgenic control embryos were heat-shocked at 10 hpf, and stained at 25 hpf for the expression of tal2 and nkx2.9 (top panel). Embryos were treated with DMSO or compound E at 13 hpf, and stained at 25 hpf for the expression of tal2 and nkx2.9 (bottom panel). tal2 and nkx2.9 staining is shown in lateral and dorsal views, respectively. Brackets indicate the extent of the LFP domain in lateral views, and arrows denote the two rows of LFP domains in dorsal views. (C) Quantification of KA′′ specification under different conditions. KA′′ cells were scored by the expression of tal2 at 25 hpf. Note that the fewer data points in compound E treatment at 13 hpf is due to the fact that most compound E-treated embryos had many tal2-positive cells in close clusters which prevents reliable scoring. Data shown therefore underestimate the total number of KA3 cells under this condition. (D) Ptc1-Kaede embryos were treated with DMSO or compound E at 14 hpf, photoconverted at 25 hpf, and stained with the GABA antibody (blue) at 37 hpf. Compound E treatment induced ectopic GABA-positive cells in the LFP domain (arrows), and abolished the expression of Ptc1-Kaedegreen (middle panel). Scale bars: 20 μm in A, D and 50 μm in B. |
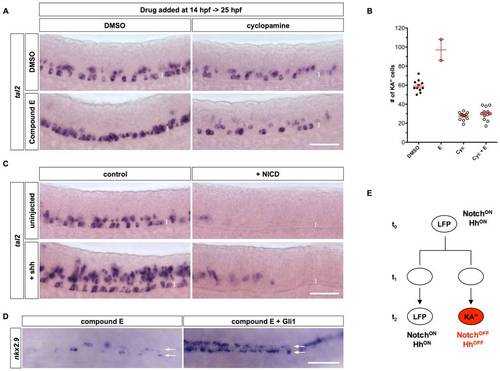
Interaction between Notch and Hh signaling in KA3 specification. (A) Embryos treated with DMSO alone, compound E, cyclopamine, or both compound E and cyclopamine from 14 hpf to 25 hpf, were stained for the expression of tal2. (B) Quantification of total number of KA′′ cells in experiments shown in A. Note that the fewer data points in compound E treatment is due to the fact that most compound E-treated embryos had many tal2-positive cells in close clusters which prevents reliable scoring. The two data points thus underestimate the total number of KA′′ cells in E-treated embryos. Cyc: cyclopamine. (C) hsp-Gal4; UAS-NICD embryos and non-transgenic sibling controls were left uninjected or injected with Shh mRNA, heat-shocked at 11.5 hpf, and stained at 24 hpf for the expression of tal2. Brackets in A and C indicate the dorsal-ventral extent of the LFP domain. Scale bars: 50 μm. (D) hsp-Gli1 embryos and non-transgenic controls were injected with compound E at 15 hpf, and heat-shocked at 16 hpf, and stained at 22 hpf for the expression of nkx2.9. Arrows denote the two rows of LFP domains in dorsal views. (E) Model of KA′′ specification. At the early stage (t0), LFP progenitors have high level of Notch signaling activity and thereby maintain the progenitor state and Hh responsiveness (NotchON HhON). Active Hh signaling in progenitor cells is required for specifying the KA′′ identity in subsequent cell divisions. LFP progenitors can undergo three different types of divisions: symmetric LFP/LFP divisions, asymmetric KA′′/LFP divisions (shown here), and symmetric KA′′/KA′′ divisions. Divisions of LFP progenitors at t1 generate daughter cells with similar competence to either acquire the KA3 fate or maintain the LFP progenitor fate. Cell-cell interactions or stochastic fluctuations in Notch signaling result in cells with different levels of Notch signaling (t2). Cells that maintain high levels of Notch signaling will remain as LFP progenitors and continue to respond Shh (NotchON HhON). In contrast, cells that have attenuated Notch signaling will lose Hh response and differentiate into KA′′ interneurons (NotchOFF HhOFF). Since sustained Notch or Hh signaling disrupt the differentiation of KA′′ cells, formation of KA′′ cells initially depends on the activation and then the attenuation of Notch and Hh signaling. |
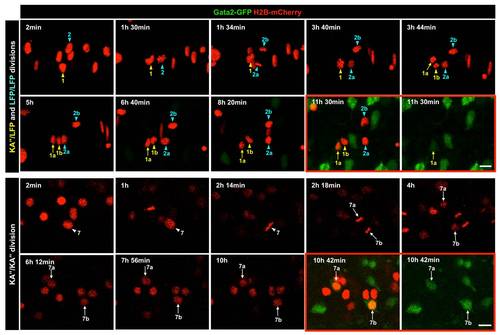
Time-lapse imaging reveals different division patterns in the LFP domain. The top panel corresponds to the time-lapse sequence of the region containing cell 1, cell 2 and their daughter cells in Figure 2C and Video S1. Each frame is a projection of confocal slices containing cells of interest. The green channel was switched on after 6.5 hours. The bottom panel shows the time-lapse sequence of the region containing cell 7 in Figure 2C. Each frame corresponds to a single optical slice containing cells of interest. The green channel was switched on at the last time point. KA′′ cells and LFP cells are denoted by arrows and arrowheads, respectively. Cell 1, 2, and 7 undergo KA′′/LFP, LFP/LFP, and KA′′/KA′′ divisions, respectively. The time point of each frame is indicated on top. For the final time point, both the merged image and the image with the green channel alone are shown (red boxes). Scale bars: 10 μm. |
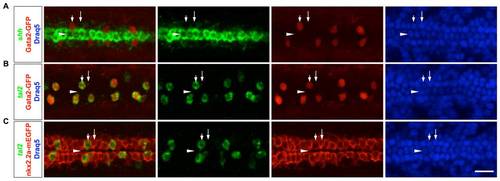
LFP cells can be reliably identified based on their locations. (A) Gata2-GFP embryos were stained with the shh probe (green), the GFP antibody (red) and the Draq5 dye (blue) to label cell nuclei. Gata2-GFP-positive KA′′ cells (short arrows) and Gata2-GFP-negative LFP cells (long arrows) flank the shh-expressing medial floor plate cells (arrowheads). (B) Gata2-GFP embryos were stained with the tal2 probe (green), the GFP antibody (red) and the Draq5 dye (blue). All Gata2-GFP-positive KA′′ cells (short arrows) also express tal2. (C) nkx2.2a-mEGFP embryos were stained with the tal2 probe (green), the GFP antibody (red) and the Draq5 dye (blue). All tal2-negative cells (long arrows) immediately flanking the medial floor plate (arrowheads) are LFP cells, indicated by the expression of membrane localized EGFP under the control of the nkx2.2a promoter (nkx2.2a-mEGFP). Dorsal views of embryos at 21 hpf are shown. Scale bars: 20 μm. |
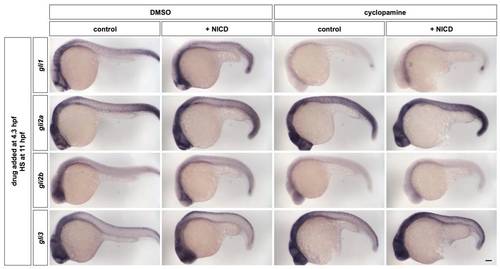
Activation of Notch signaling by NICD does not induce the expression of gli genes. hsp-Gal4; UAS-NICD embryos and non-double-transgenic sibling controls were treated with DMSO or cyclopamine at 4.3 hpf, heat-shocked at 11 hpf, and stained at 24 hpf for the expression of gli1, gli2a, gli2b, and gli3. Note that in cyclopamine-treated embryos (right panels), NICD-overexpressing embryos have similar level of expression of gli gene as control embryos, indicating that Notch signaling does not induce gli transcription in the absence of Hh signaling. Lateral views of embryos are shown. Scale bar: 100 μm. |