
- Title
-
Hedgehog-dependent proliferation drives modular growth during morphogenesis of a dermal bone
- Authors
- Huycke, T.R., Eames, B.F., and Kimmel, C.B.
- Source
- Full text @ Development
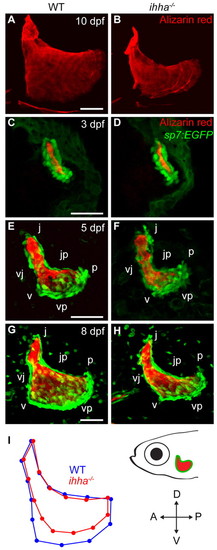
ihha is required for proper Op morphogenesis. Confocal projections and morphometric analysis of the Alizarin Red-stained Op in live wild-type and ihha mutant zebrafish larvae expressing sp7:EGFP (C-H). Images are lateral views with dorsal upwards and anterior towards the left. (A,B) The Op is mis-shapen and reduced in dorsoventral length in ihha mutants. (C,D) The ihha mutant Op has wild-type morphology at 3 dpf. (E-H) The ihha mutant Op is malformed at 5 and 8 dpf. (I) Average configuration of landmarks from morphometric analysis of the Op for n=23 wild type (blue) and n=22 ihha mutants (red) shows shape differences anterior and ventral to the v apex. The centroid size of the Op calculated from the same set of data is significantly smaller in ihha mutants (one-way ANOVA mean±s.e.m.: wild type=0.198±0.00544; ihha=0.181±0.00532, P=0.0293). j, joint apex; p, posterior apex; v, ventral apex; jp, edge connecting j and p; vj, edge connecting v and j; vp, edge connecting v and p. Scale bars: 50 μm. EXPRESSION / LABELING:
PHENOTYPE:
|
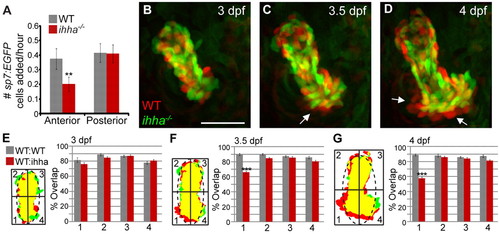
ihha is required for regional Op growth through cell addition. Aligned and overlapping confocal projections of a wild-type Op (red) and an ihha mutant Op (green) from a time-lapse of sp7:EGFP-expressing larvae (see supplementary materialMovie 1) reveal early shape changes due to reduced cell addition. Images are lateral views with dorsal upwards and anterior towards the left. (A) Quantitation of peripheral osteoblast addition to the anterior and posterior halves of the Op from 3-4 dpf shows decreased anterior, but not posterior, cell addition. (B-D) Osteoblasts are added to the anteroventral region of the wild-type Op after 3 dpf (arrows) but are lacking in ihha mutants. (E-G) Threshold images derived from A-C showing separation of the Op into quadrants by a best-fit ellipse (broken line). Alignments are accompanied by graphs representing the fraction of wild-type Op that overlaps with ihha mutant Op (WT:ihha, 36 comparisons) or the fraction of wild-type Op overlapping with another wild-type Op (WT:WT, 21 comparisons) for each quadrant/time point. (E) WT:ihha overlap at 3 dpf is not significantly different from WT:WT overlap. The anteroventral edge (quadrant 1) shows a significant reduction in WT:ihha overlapping area at 3.5 dpf (F) and 4 dpf (G), but other quadrants are not significantly altered. Data are presented as mean±s.d., **P<0.01 by unpaired t-test, ne7 per genotype (A); and mean±s.e.m. ***P<0.001 by Tukey-Kramer method following one-way ANOVA, n=6 per genotype in E-G. Scale bar: 50 μm. EXPRESSION / LABELING:
PHENOTYPE:
|
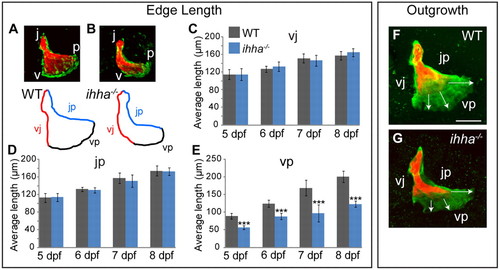
Growth along the vp edge is regulated by ihha. Quantitation of Op edge lengths and outgrowth. Images are lateral views with dorsal upwards and anterior towards the left. (A,B) Images and drawn outlines of the 7 dpf Op showing the vj, jp, and vp edges as defined by Alizarin Red and sp7:EGFP-expressing osteoblast localization (see Fig. 1). (C-E) vp edge length is significantly reduced in ihha mutants (E), whereas jp (D) and vj (C) edge lengths are unchanged. (F,G) Double labeling of the Op at 5 dpf with Alizarin Red and at 8 dpf with calcein (green) indicates specifically reduced ventral Op outgrowth in ihha mutants. Data are presented as mean±s.d., ***P<0.001 by unpaired t-test, ne7 per genotype/timepoint. Images in F and G are representative of ne6 larvae per genotype. v, ventral apex; p, posterior apex; j, joint apex; vp, edge connecting v and p; vj, edge connecting v and j; jp, edge connecting j and p. Scale bar: 50 μm. |
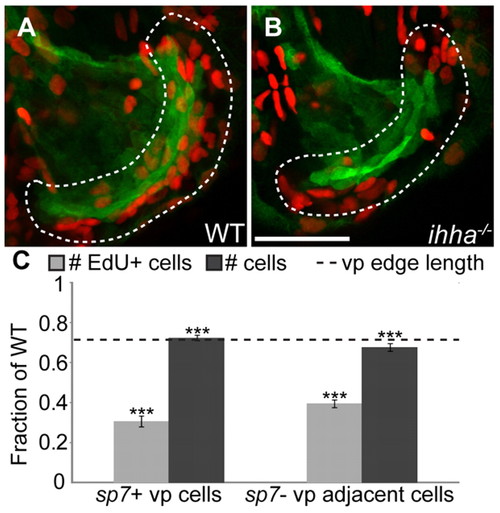
ihha controls cell proliferation. Quantitation of cell proliferation in ihha mutants and wild-type siblings. Images are lateral views with dorsal upwards and anterior towards the left. (A,B) Confocal projections of the Op at 5 dpf showing sp7:EGFP-expressing osteoblasts (green) and EdU-positive (EdU+) cells (red). (A) EdU+ cells are mostly found along the actively growing vp edge in wild type. (B) Fewer EdU+ cells are apparent along the vp edge in ihha mutants. Scale bar: 50 μm. (C) Quantitation of EdU+ cells along the vp edge as a fraction of wild-type levels shows that the amount of EdU+ cells is significantly decreased in ihha mutants. Cells included in the count, represented by dashes in A and B, are those within two cell diameters of the vp edge that express sp7:EGFP (sp7+ vp cells) or those that do not (sp7–, vp adjacent cells). The number of total cells stained with SYTO-59 was counted with the same parameters in a separate experiment and is decreased to a lesser extent than the number of EdU+ cells, but proportional to the decrease in vp edge length (shown as a broken line and based on Fig. 3). Data are presented as mean±s.e.m., ***P<0.001 by unpaired t-test, ne10 per genotype. |
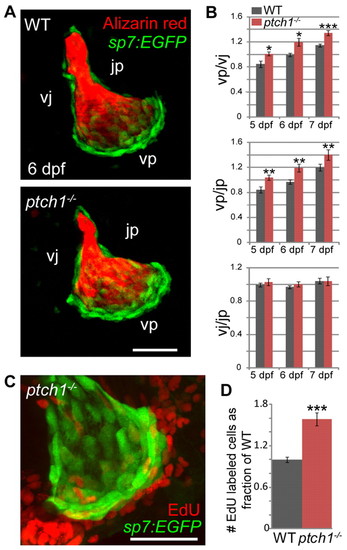
ptch1 represses bone growth and proliferation. Quantitation of Op edge lengths and cell proliferation in ptch1 mutants. Images are lateral views with dorsal upwards and anterior towards the left. (A) Confocal projections of ptch1 mutants and wild-type siblings carrying the sp7:EGFP transgene at 6 dpf demonstrate an apparent elongation of the vp edge in ptch1 mutants. (B) vp/jp and vp/vj ratios are significantly greater in ptch1 mutants relative to wild-type siblings. Conversely, the vj/jp ratio is unaffected in ptch1 mutants. (C,D) ptch1 mutants display a significant increase in EdU-positive cells within two cell diameters of the vp edge at 5 dpf (compare with wild type in Fig. 4 as number of proliferating cells in wild-type larvae was similar between the two experiments). Note that neuromast cells that are occasionally apparent near the v apex were not included in the count. Data are presented as mean±s.e.m., *P<0.05, **P<0.01, ***P<0.001 by unpaired t-test, ne7 per genotype/age. v, ventral apex; p, posterior apex; j, joint apex; vp, edge connecting v and p; vj, edge connecting v and j; jp, edge connecting j and p. Scale bars: 50 μm. |
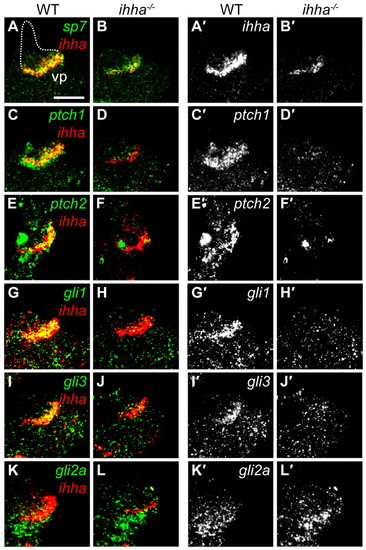
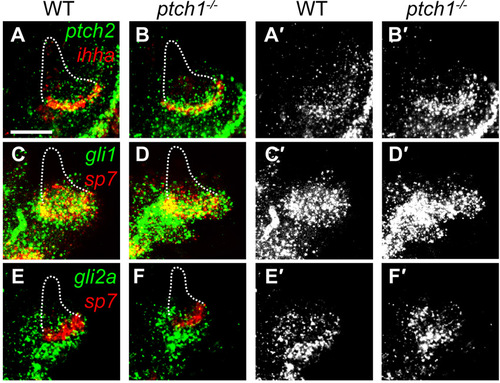
Hh signaling is regionally localized. Confocal sections showing Hh pathway gene expression at 5 dpf by whole-mount in situ hybridization. Images show expression of genes relative to ihha (A-L) and a separated channel with individual gene expression (A′-L′) from respective images. Images are lateral views with dorsal upwards and anterior towards the left. (A,A′) ihha is co-expressed with sp7 and specifically demarcates the vp edge. Other Op edges deduced by DIC are shown with a broken line. (B,B′) sp7 expression appears similar to wild type in ihha mutants, although the domain may be slightly reduced, reflecting the diminished vp edge length. ihha expression is reduced in ihha mutants. (C,C′) ptch1 is expressed ventral to vp edge osteoblasts and is also co-expressed with ihha along the vp edge. (D,D′) Expression of ptch1 is lost in ihha mutants. (E-F2) ptch2 expression resembles that of ptch1. (G-J′) gli1 and gli3 are co-expressed with ihha and their expression is decreased in ihha mutants. (K-L′) gli2a is expressed just ventral to the vp edge and its expression is unaltered in ihha mutants. Scale bar: 50 μm. |
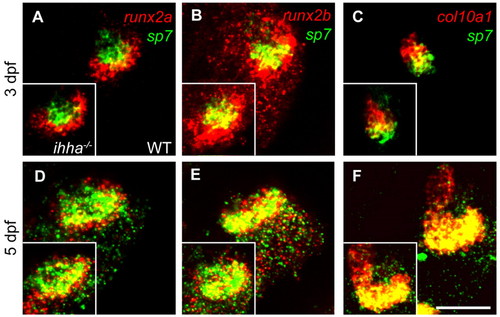
Osteoblast stage markers are unaffected in ihha mutants. Confocal projections showing expression of osteoblast markers at 3 and 5 dpf by whole-mount fluorescent in situ hybridization. Wild-type expression is shown in the main panels and ihha mutant expression is shown in the insets. Images are lateral views with dorsal upwards and anterior towards the left. (A,B) At 3 dpf, runx2a/b expression surrounds and overlaps ventral sp7 expression in the Op, and is unchanged in ihha mutants. (C) col10a1 is expressed in the dorsal Op at 3 dpf and is unchanged in ihha mutants. (D,E) At 5 dpf, runx2a/b expression colocalizes with sp7 along the vp edge and is also apparent ventral to the vp edge in non-sp7-expressing cells. Expression is similar in ihha mutants. (F) At 5 dpf, col10a1 is expressed at high levels throughout the Op. The domains of these markers appear slightly reduced at 5 dpf, matching the reduction in Op size. Scale bar: 50 μm. EXPRESSION / LABELING:
PHENOTYPE:
|
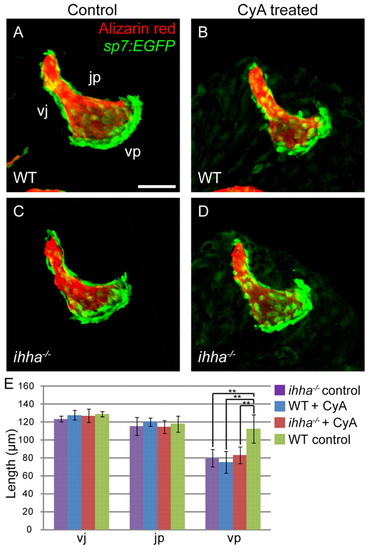
Cyclopamine (CyA) induces vp edge length reduction. Confocal projections of the Op in larvae treated with CyA. Images are lateral views with dorsal upwards and anterior towards the left. (A-C) Wild-type larvae treated with CyA (B) display a reduction in vp edge length and phenocopy ihha mutants (C). (D) Mutants treated with CyA look similar to untreated siblings. (E) Measurements of vj, jp and vp edge lengths for all four treatment categories. Lengths of vj and jp are not statistically different when compared between all possible combinations of treatments. Length of the vp edge is significantly reduced in CyA-treated wild-type larvae compared with wild-type controls, but is not significantly different from ihha mutants treated with CyA or ethanol. Data are presented as mean±s.d., **P<0.01 by Tukey-Kramer test, ne5 per treatment category. vp, edge connecting v and p; vj, edge connecting v and j; jp, edge connecting j and p. Scale bar: 50 μm. |
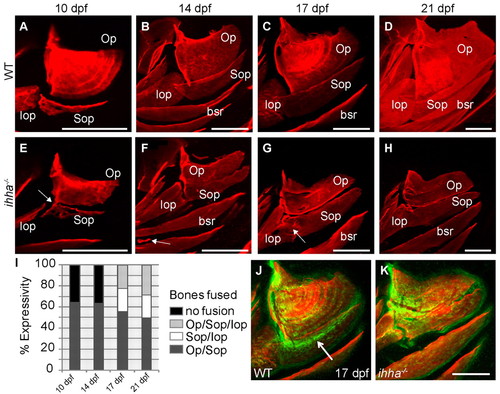
ihha is required for proper joint formation between dermal bones. Images are lateral views with dorsal upwards and anterior towards the left. (A-H) Confocal projections of live wild-type and ihha mutant larvae stained with Alizarin Red. (A-D) Wild-type Op and adjacent bones from 10 to 21 dpf. (E) ihha mutant at 10 dpf with reduced ventral length and fusions between the ventral Op edge and dorsal Sop edge (arrow). (F) ihha mutant at 14 dpf with a nearly complete fusion of the Op and Sop, and ectopic ossification between the branchiostegal rays (arrow). (G) ihha mutant at 17 dpf with an Sop-Iop fusion (arrow), but no Op-Sop fusion. (H) ihha mutant at 21 dpf showing Iop-Sop fusion and reduced Op size. (I) Representation of the percentage expressivity of each fusion phenotype apparent in a single clutch of ihha mutants from 10 to 21 dpf. (J,K) Confocal projections of the Op stained with Alizarin Red in larvae expressing the trps1:EGFP transgene (green) as a joint marker. (J) High levels of trps1:EGFP expression are detectable in the dorsal Op joint and immediately ventral to the vp edge (arrow), overlapping the Sop. (K) ihha mutants with Op-Sop fusions show decreased trps1:EGFP expression along the presumed vp edge where the bones are now fused. bsr, branchiostegal ray; Iop, interopercle; Op, opercle; Sop, subopercle. Scale bars: 200 μm. EXPRESSION / LABELING:
PHENOTYPE:
|
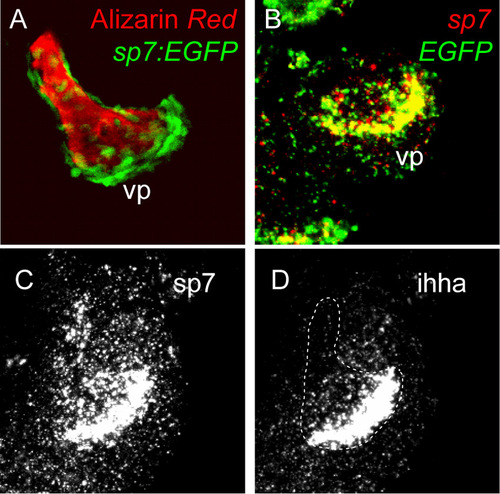
ihha is exclusively expressed along the vp edge and colocalizes with sp7:EGFP expression. Confocal projections of whole-mount fluorescent in situ hybridization at 5 dpf. (A) The sp7:EGFP transgene is expressed highly along the vp edge at 5 dpf. (B) Endogenous sp7 expression colocalizes with transgene expression with high levels seen specifically along the vp edge at 5 dpf. (C) Confocal projection of an image with overexposed vp edge expression to show sp7 expression at lower levels throughout the entire Op. (D) Overexposed image of ihha expression reveals exclusive expression along the vp edge. |
Targets of active Hh signaling are upregulated in ptch1 mutants. Confocal projections showing Hh pathway gene expression at 5 dpf by whole-mount fluorescent in situ hybridization. Images show expression of genes relative to ihha or sp7 (A-H) and a separated channel with individual gene expression (A′-F′) from respective images. (A-D2) Expression of ptch2 and gli1 is upregulated along and ventral to the vp edge in ptch1 mutants, but not along other bone edges. (E-F′) Expression of gli2a appears unchanged in ptch1 mutants. Dashes represent the outline of the other Op edges. Images are representative of ne11 mutants and an equivalent number of wild-type siblings per label. Scale bar: 50μm. |
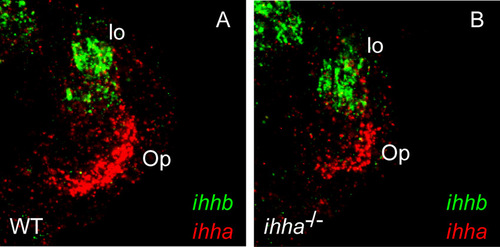
ihhb is not expressed in the Op. Single confocal sections of whole-mount fluorescent in situ hybridizations at 5 dpf. (A) ihhb is expressed dorsal to the jp edge of the Op, presumably in the levator operculi (lo) muscle, but does not colocalize with ihha expression. (B) The loss of ihha does not affect ihhb expression. |
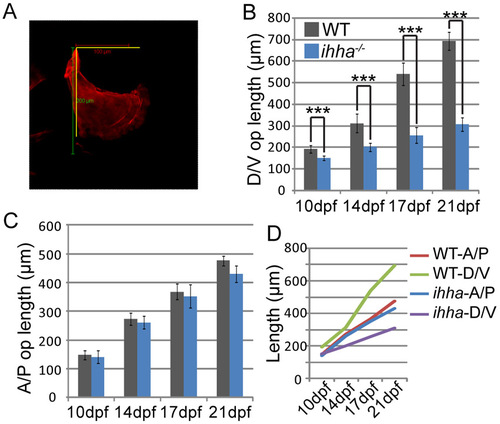
ihha regulates ventral outgrowth of the Op. Quantitation of dorsoventral (D/V) and anteroposterior (A/P) Op outgrowth during later larval development. (A) Example of how measurements were taken for overall A/P and D/V lengths on a 10 dpf wild-type Op stained with Alizarin Red. D/V length is a straight vertical line adjoining the dorsal tip of the joint (j apex) to the ventral-most apex on the anterior edge (v apex). A/P length is a straight horizontal line connecting the j apex to a distance equivalent to the posterior dorsal apex (p apex). (B) ihha mutants consistently show a significant decrease in D/V Op length compared with wild type, with the overall difference increasing with time. (C) A/P growth is not significantly different at any of the four time points. (D) ihha mutant A/P growth rate is relatively equivalent to the wild-type growth rate, but the D/V growth rate becomes increasingly disparate from wild type during development. Data are presented as mean±s.d., ***P<0.001, ne7 per genotype at each time point. |