
- Title
-
The smooth muscle microRNA miR-145 regulates gut epithelial development via a paracrine mechanism
- Authors
- Zeng, L., and Childs, S.J.
- Source
- Full text @ Dev. Biol.
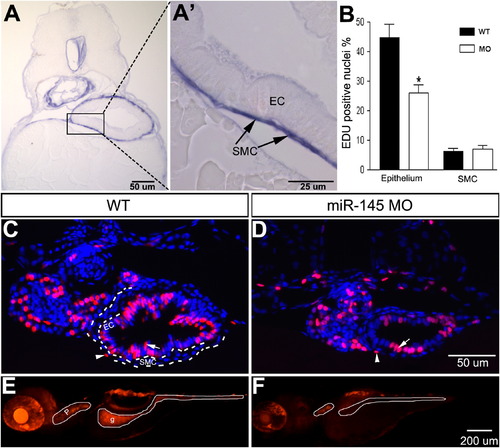
Knockdown of smooth muscle expressed miR-145 results in epithelial proliferative and functional defects. (A) A transverse section of miR-145 stained embryos at 96 hpf shows strong and specific expression in gut smooth muscle cells (SMC) but not in epithelial cells (EC). (A2) is an enlargement of the boxed area in (A). (B) Quantification of the percentage of EDU positive proliferating cells in epithelial and smooth muscle layers (SMC) at 96 hpf shows decreased cell proliferation in the miR-145 morphant epithelial layer (P<0.01). (C, D) Examples of wild type (WT, C) and miR-145 morphant (D) transverse sections used for the quantification in (B) showing EDU positive cells (red) in the gut epithelium (arrow) but scarce EDU positive cells in smooth muscle layer (arrowhead). Sections are counterstained with DAPI (blue). (E, F) Lateral view of 120 hpf whole-mount larvae after ingestion of Rhodamine Dextran shows dye in the pharynx (p) and gut (g) of wild type embryos (E), but only in the pharynx of miR-145 morphants (F). The magnification for C, D is in panel D, and for E, F is in F. |
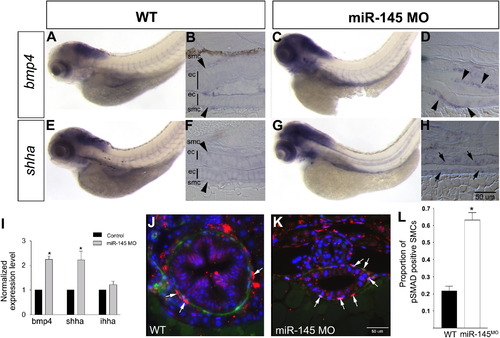
Upregulation of Bmp4 and Shha in the gut of miR-145 morphants. Lateral view of whole-mount in situ expression of bmp4 (A, C) and shha (E, G) shows that both genes have increased expression in miR-145 morphant guts at 96 hpf. Longitudinal sections show that bmp4 (B, D) is expressed in smooth muscle cells (smc; arrowheads) and shha (F, H) is expressed in epithelial cells (ec; arrows). The magnification for B, D, F and H is shown by the scale bar in H. (I) Quantitative PCR shows that knockdown of miR-145 leads to strong up-regulation of bmp4 and shha but not the related gene ihha in miR-145 morphants as compared to control embryos (p<0.01, n=3). (J–K) Increased numbers of pSMAD 1, 5, 8 positive (red; white arrow) smooth muscle cells (green) are found in miR-145 morphants (K) as seen in transverse sections of the gut compared to WT (J), counterstained with DAPI (blue). The scale bar in K represents the magnification for J and K. (L) Graph of the proportion of pSMAD 1, 5, 8 positive SMCs. Significance was determined using the student′s t test (p<0.01) EXPRESSION / LABELING:
|
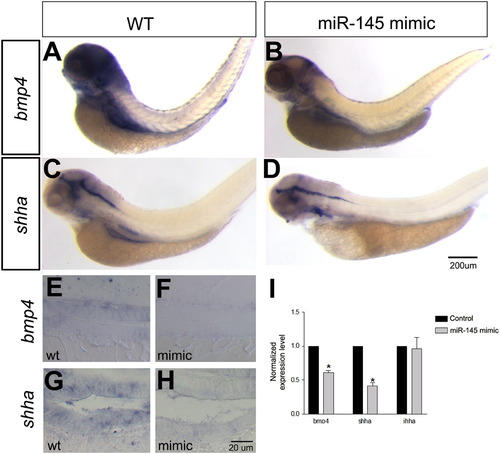
Bmp4 and Shha are downregulated in the gut of miR-145 overexpressing embryos. Overexpression of miR-145 using a miR-145 mimic leads to decreased bmp4 as seen in whole-mount (A, B) and longitudinal section (E, F), and to decreased expression of shha as seen whole-mount (C, D) and in cross section (G, H). (I) Quantification of expression changes in miR-145 mimic shows strong down-regulation of bmp4 and shha but not ihha levels in miR-145 mimic injected embryos. Significance was determined by a Student′s t-test (p<0.01). The scale bar for A–D is shown in panel D, and the scale bar for E–H is in panel H. |
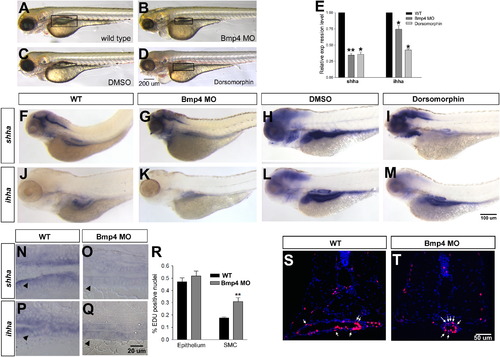
Knockdown of bmp4 negatively regulates shha expression and promotes SMC proliferation. bmp4 morphants (Bmp4 MO; A, B) and dorsomorphin treated embryos (C, D) show mild pericardial edema at 96 hpf (B, D) as compared to wild type embryos (A, C). At 96 hpf bmp4 morphants or dorsomorphin treated embryos show an underdeveloped gut (boxed area, B, D) as compared to wild type embryos (A, C). (E) Loss of Bmp4 leads to strong down-regulation of both shha and ihha at 96 hpf by qPCR (* refers to p<0.05; ** refers to p<0.01; n=3) as compared to wild type. Reduced shha and ihha expression is also seen in bmp4 morphants and dorsomorphin treated embryos as compared to wild type (F–M). (N–Q) The reduction in staining is also evident in longitudinal section. (R) The percentage of EDU positive smooth muscle and epithelial cells was quantified in wild type and bmp4 morphant embryos. There is no significant change of the percentage of EdU positive cell in the epithelium, but a significant upregulation of EDU positive smooth muscle cells (SMC). (S,T) Transverse sections of EdU stained cells (red) in the gut of 96 hpf embryos, counterstained with DAPI (blue). Proliferative SMCs are indicated by arrows. The magnification for A–D is shown in D, for F–M is in M, for N–Q is in Q, and for S, T is in T. |
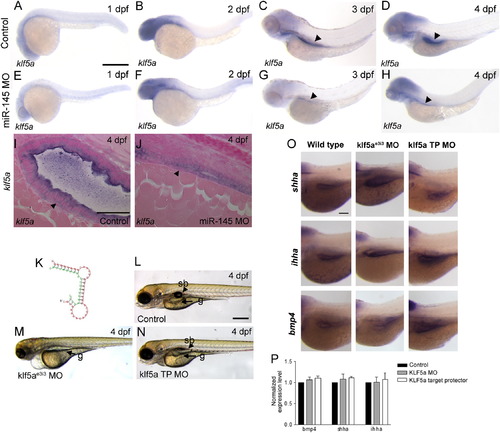
klf5a does not modulate bmp4, shha or ihha expression in the gut. (A–H) Whole-mount expression of klf5a. klf5a expression is ubiquitous at 1 dpf (A), restricted to the head at 2 dpf (B), and is observed in the head and developing gut (arrowheads) at 3 and 4 dpf (C, D). (E–H) Expression of klf5a is unchanged in miR-145 morphants at the same stages. Compared to wild type embryos at 4 dpf (I), miR-145 morphants (J) show abnormal intestinal epithelial morphology with a lack of a lumen and rounded cells, but no difference in klf5a expression. Smooth muscle cells are indicated by arrowhead. (K) Folding diagram of the predicted potential miR-145 target site in the zebrafish klf5a 32UTR. The klf5a 32UTR is in red and the miR-145 mature sequence is indicated in green. (L–N) Phenotype of klf5ae3i3 morphants (M) as compared to klf5a target protector morphants (klf5aTP MO; N) and wild type embryos (L). klf5ae3i3 morphants show an immature gut (g), lack of swim bladder (sb), pericardial edema and hemorrhage while klf5a target protector morphants have a normal morphology with the exception of a reduced swim bladder. (O, P) Comparison of bmp4a, shha and ihha expression in the gut of wild type embryos, klf5ae3i3 morphants and klf5a TP morphants shows no differences by whole-mount in situ staining in the gut region (O), or quantitative PCR of embryo trunks (P). The magnification for A–H is shown in A, for I, J is shown in I, for L, M, N is in L, and for O is in the top left panel. All scale bars represent 100 μm. |
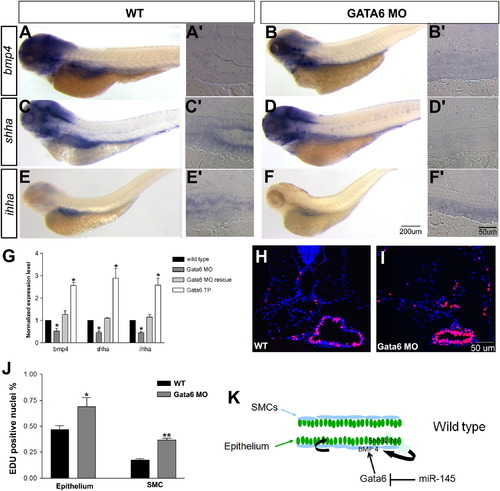
gata6 positively regulates bmp4 and shha expression, and negatively regulates epithelial and smooth muscle proliferation. (A–F): Expression of bmp4, shha and ihha is decreased in the gut of gata6 morphants at 96 hpf by in situ hybridization (A–F) and qPCR of embryonic trunk (G) as compared to wild type (WT). A2–F2 are longitudinal sections of stained embryos in the midgut region. (H–I) Transverse sections of the gut show strong EDU staining in both epithelial and smooth muscle layers in WT embryos (H) and gata6 morphants (I) at 96 hpf. (J) Quantification of EdU positive epithelial and smooth muscle cells shows significantly increased proliferative cells in both layers of the gata6 morphant gut. (* indicates p<0.05; ** indicates p<0.01). (K) Model for miR-145 regulation of visceral paracrine pathways. The visceral smooth muscle cells (SMCs) are shown in light blue and the gut epithelium in dark green. In wild type embryos, Hedgehog family members are expressed in the epithelium and responsible for the induction of the bmp4 in the adjacent smooth muscle layers. MiR-145 normally inhibits expression of gata6, maintaining low bmp4 expression levels in smooth muscle cells. When miR-145 is downregulated, gata6 expression increases, promotes bmp4 expression, and via paracrine secretion, activates higher expression of both shh and ihh in the epithelial layer in a positive feedback loop, leading to decrease proliferation of both layers. The magnification for A–F is shown in F, for A2–F2 is shown in F2 and for H, I is shown in I. |
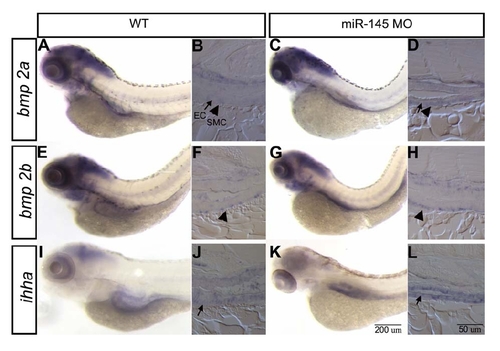
Expression of bmp2a, bmp2b and ihha is unchanged in the gut of miR145 morphants Lateral view of whole mount in situ hybridization shows that bmp2a, bmp2b and ihha remain similar expression level after miR145 is knocked down in the gut of 96 hpf embryos. Sections to the right of the wholemount embryo represent longitudinal sections of the whole mount embryos. Sections show the expression of bmp2a and bmp2b is only restricted to smooth muscle cell (SMC; indicates by arrowhead) and ihha is expressed in the epithelial cell (EC; indicated by arrow). The magnification for wholemount embryos and sections is shown by the scale bar in K and L respectively. EXPRESSION / LABELING:
|
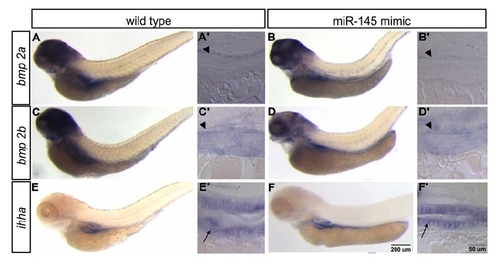
Expression of bmp2a, bmp2b and ihha are unchanged in the gut of miR145 overexpressing embryos Lateral view of whole mount in situ hybridization shows that bmp2a, bmp2b and ihha remain at similar expression levels after miR145 is overexpressed in the gut of 96 hpf embryos. Sections to the right of the whole mount embryo represent longitudinal sections of the whole mount embryos. Sections show the expression of bmp2a and bmp2b is only restricted to smooth muscle cell (arrowhead) and ihha is expressed in the epithelial cell (arrow). The magnification for AF is shown by the scale bar in F and A′F′ is shown by the scale bar in F′. |

Loss of Klf5 by splice morpholino shows heart and gut phenotypes. (AD) Hydrocephalus (arrowhead) is observed at 48 hpf in klf5ae3i3 MO morphants (B) as compared with WT embryos (A). klf5a e3i3 morphants show malformation of the gut at 96 hpf (arrow, D) as compared with WT embryos (C). The magnification for AD is shown by the scale bar in D. (E) Amplification of klf5a cDNA with primers flanking the exon 3 shows a reduction of the transcript in klf5a e3i3 morphant. ef1α serves as a loading control. (F) qPCR expression analysis of bmp4, shha and ihha in klf5a morphants shows no significant change when compared with WT at 96 hpf in klf5ae3i3 morphants. PHENOTYPE:
|

Unillustrated author statements |
Reprinted from Developmental Biology, 367(2), Zeng, L., and Childs, S.J., The smooth muscle microRNA miR-145 regulates gut epithelial development via a paracrine mechanism, 178-186, Copyright (2012) with permission from Elsevier. Full text @ Dev. Biol.