
- Title
-
Different levels of Notch signaling regulate quiescence, renewal and differentiation in pancreatic endocrine progenitors
- Authors
- Ninov, N., Borius, M., and Stainier, D.Y.
- Source
- Full text @ Development
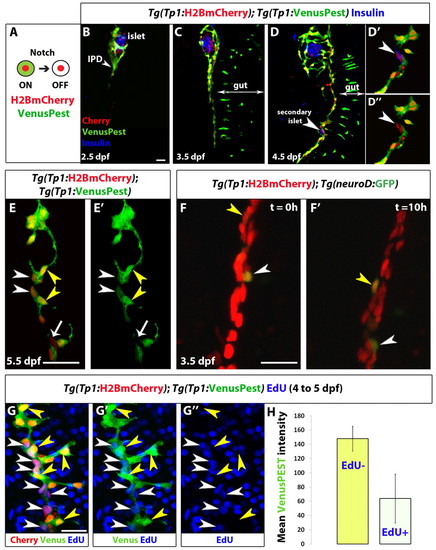
Distinct levels of Notch signaling determine differentiated or quiescent states of NRCs. (A) Tg(Tp1:H2BmCherry) drives expression of H2BmCherry, which has a very long half-life, in NRCs. Tg(Tp1:VenusPest) drives expression of a destabilized VenusPEST fluorescent protein, which has a short half-life, in NRCs. Cells with active Notch signaling are Tg(Tp1:H2BmCherry)+ and Tg(Tp1:VenusPest)+. Cells that had active Notch signaling but lost Notch signaling are Tg(Tp1:H2BmCherry)+ but Tg(Tp1:VenusPest)- (supplementary material Fig. S1A-C, Fig. S2). (B-D3) Tg(Tp1:H2BmCherry); Tg(Tp1:VenusPest) larvae were fixed at progressive developmental stages and stained for Insulin to visualize β-cells. NRCs undergo cell shape changes, migration and proliferation to build the IPD. (D-D′′) At 4.5 dpf, a pair of β-cells (white arrowhead) have formed a secondary islet along the IPD. To better visualize these cells, a high magnification single plane is shown in D2,D3 with separate channels. The two β-cells (arrowheads) are Tg(Tp1:H2BmCherry)+ but Tg(Tp1:VenusPest)-, indicating that they originated from NRCs that turned off Notch signaling. (E,E′) Tg(Tp1:H2BmCherry); Tg(Tp1:VenusPest) larvae were fixed and examined at 5.5 dpf. A single plane through the IPD is shown. Based on the fluorescence intensity of Tg(Tp1:VenusPest) expression, NRCs are Tg(Tp1:VenusPest)hi (yellow arrowheads), Tg(Tp1:VenusPest)low (white arrowheads) or Tg(Tp1:VenusPest)- (arrow), indicating that they experience different levels of Notch signaling. (F,F′) Live imaging of Tg(Tp1:H2BmCherry); Tg(neurod:EGFP) larva at 3.5 dpf. Tg(Tp1:H2BmCherry) expression labels NRCs (red) and Tg(neurod:EGFP) expression labels endocrine cells and their direct progenitors (green). White arrowheads indicate a differentiating endocrine cell. Yellow arrowheads indicate a single NRC that, over time, upregulates Tg(neurod:EGFP) expression, suggesting onset of endocrine lineage differentiation. The cells shift position over time owing to the morphogenesis of the pancreas. (G-G3) Tg(TP1:H2BmCherry); Tg(TP1:VenusPEST) larvae were incubated with EdU from 4 to 5 dpf for cell cycle analysis. Yellow arrowheads indicate Tg(TP1:VenusPEST)hi NRCs; the majority are EdU-, whereas neighboring NRCs with lower levels of Tg(TP1:VenusPEST) expression are EdU+ (white arrowheads). (H) Mean Tg(TP1:VenusPEST) fluorescence intensity was calculated for 163 EdU- and 109 EdU+ NRCs (from confocal stacks of four larvae). The average mean fluorescence intensity value (±s.d.) between larvae for EdU- NRCs was 148 (s.d.=17.4) and for EdU+ NRCs was 63.9 (s.d.=34.2) (P<0.01). All images are lateral views, anterior towards the top, ventral towards the right. The NRCs ventral to the IPD in C, D and F are gut cells. Scale bars: 20 μm. |
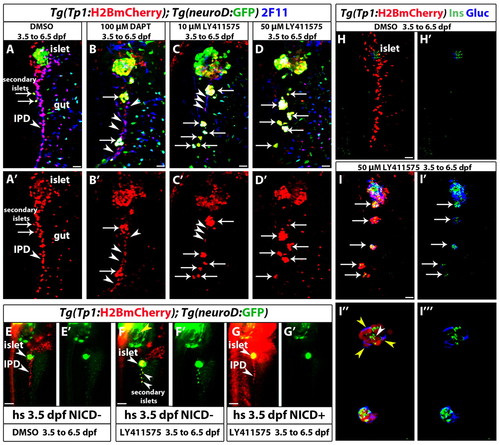
Increasing the level of Notch signaling downregulation leads to an increase in endocrine differentiation of NRCs. (A-D2) Tg(Tp1:H2BmCherry); Tg(neurod:EGFP) larvae were used to label NRCs (red) and follow endocrine differentiation (green). Larvae were treated with (A) DMSO, (B) 100 μM DAPT, (C) 10 μM LY411575 and (D) 50 μM LY411575 from 3.5 to 6.5 dpf and analyzed at 7.5 dpf. 2F11 staining marks the IPD. (A,A2) In control larvae, the pancreatic NRCs form the IPD, as assessed by 2F11 immunoreactivity (arrowhead). White arrows indicate endocrine cells along the IPD. (B,B2) In the DAPT-treated larvae, some NRCs posterior to the PI differentiate into the endocrine lineage, as assessed by Tg(neurod:EGFP) expression (arrows). The majority of NRCs retained IPD cell identity, as assessed by 2F11 immunoreactivity (arrowheads), and did not undergo endocrine differentiation (arrowheads). (C,C2) In the larvae treated with 10 μM LY411575, a smaller number of NRCs retained IPD cell identity (compared with B), as assessed by 2F11 immunoreactivity (arrowheads). Note that the majority of Tg(Tp1:H2BmCherry)+ cells differentiated into endocrine cells, as assessed by Tg(neurod:EGFP) expression. Arrows indicate endocrine cells. (D,D2) In the larvae treated with 50 μM LY411575, the vast majority of NRCs converted into endocrine cells, turned on Tg(neurod:EGFP) expression and aggregated into secondary islets (arrows). The IPD network was absent, as assessed by 2F11 immunoreactivity. (E-G2) Larvae obtained from a cross of Tg(hsp:Gal4); Tg(UAS:myc-Notch1a-intra) hemizygous and Tg(Tp1:H2BmCherry); Tg(neurod:EGFP) fish were heat shocked at 3.5 dpf to induce myc-Notch1a-intra expression and incubated in DMSO or 10 μM LY411575 until 6.5 dpf. (E,E2) A DMSO-treated (myc-Notch1a-intra)– larva. Upper arrowhead, PI; lower arrowhead, IPD. (F,F2) A LY411575-treated (myc-Notch1a-intra)– larva with ectopic secondary islets (lower arrowheads). Note the increased size of the PI (upper arrowhead; compare with E). [Tg(neurod:EGFP) expression is also increased in the brain (yellow arrowhead).] (G,G2) A (myc-Notch1a-intra)+ larva treated with LY411575. No secondary islets were present along the IPD (lower arrowhead) and no increase in the size of the PI was observed (upper arrowhead). Note the dramatic increase in Tg(Tp1:H2BmCherry) expression. (H-I32) Tg(Tp1:H2BmCherry) larvae treated with (H,H2) DMSO and (I-I32) 50 μM LY411575 from 3.5 to 6.5 dpf, and stained for glucagon and insulin at 7.5 dpf. In the LY411575-treated larvae, NRCs have formed five islets posterior to the PI (arrows). These islets contain NRC-derived α- and β-cells. (I3,I32) High-magnification projections of several planes for two of the islets (for the full stack, see supplementary material Movie 4). Yellow and white arrowheads in I3 point to α- and β-cells, respectively. All images are lateral views, anterior towards the top, ventral towards the right. 2F11+, Tg(Tp1:H2BmCherry)+ and Tg(neurod:EGFP)+ cells ventral to the IPD are gut cells. Scale bars: 20 μm in A-D2,H-I2 100 μm in E-G. |
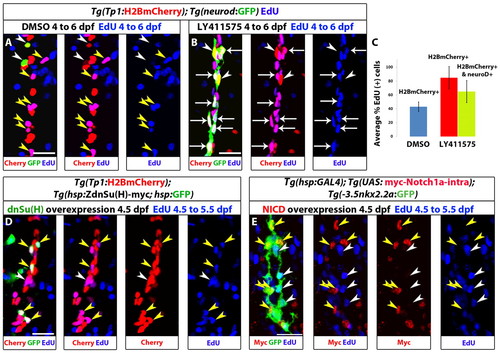
Notch signaling downregulation induces cell cycle progression of NRCs, whereas Notch signaling upregulation triggers their quiescence. (A-C) Larvae were treated with DMSO or 10 μM LY411575 from 4 to 6 dpf (52 hours) in the presence of EdU. (A) DMSO-treated control larva. Yellow arrowheads indicate EdU+ NRCs; white arrowheads indicate two endocrine cells along the IPD (projection of several planes). (B) The LY411575-treated larva showed an increase in the number of endocrine cells. Note that the majority of the new endocrine cells are EdU+ (arrows) and only two endocrine cells are EdU– (arrowheads) (projection of several planes). Upon endocrine differentiation, however, NRCs exit the cell cycle (see supplementary material Fig. S3B,C). (C) Quantification of average percentage of EdU+ cells for A and B. Blue bar: on average, 43% of the NRCs in DMSO controls were EdU+ (140 cells counted in 7 larvae). Red bar: on average, 85% of the NRCs not undergoing endocrine differentiation in LY411575-treated larvae were EdU+ (140 cells counted in 7 larvae) (P<0.001). Green bar: the majority (65%) of new endocrine cells were EdU+ (129 cells counted in 7 larvae). Error bars indicate s.d. (D,E) Larvae were heat shocked at 4.5 dpf to induce mosaic expression of (D) ZdnSu(H)-myc or (E) myc-Notch1a-intra, and incubated in EdU for 24 hours (4.5 to 5.5 dpf). EdU incorporation was scored in cells positive or negative for the transgenes. (D) (ZdnSu(H)-myc)+ cells are identified by GFP expression (supplementary material Fig. S4A). Yellow arrowheads indicate five GFP+ NRCs, all of which are EdU+. Neighboring GFP– NRCs (white arrowheads) incorporate EdU stochastically (projection of several planes). Eighty-one percent of GFP+ NRCs were EdU+ (104 cells counted in 52 larvae), whereas 42% of GFP– NRCs were EDU+ (351 cells counted in nine larvae). (E) Myc staining marks myc-Notch1a-intra overexpressing cells (red) and Tg(Nkx2.2a:GFP) expression marks IPD cells (green). Myc+ IPD cells are EdU– (yellow arrowheads). EdU incorporation is restricted to neighboring Myc- IPD cells (white arrowheads) (projection of several planes). All images are lateral views, anterior towards the top, ventral towards the right. Scale bars: 20 μm. |
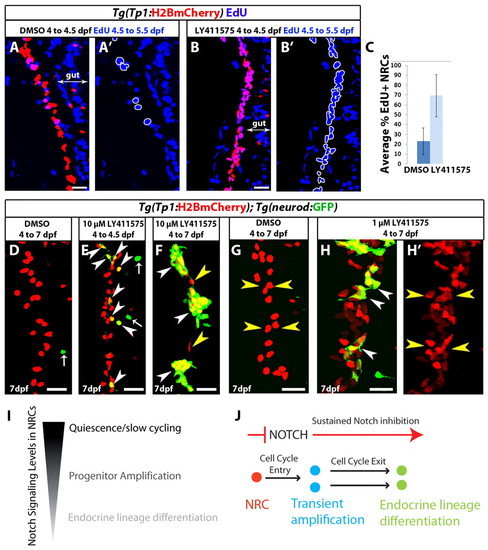
Progenitor amplification and differentiation can be uncoupled by modulating the duration and/or extent of Notch signaling downregulation. (A-B2) Tg(Tp1:H2BmCherry) larvae were used to label NRCs (red). Larvae were treated with DMSO or 10 μM LY411575 from 4 to 4.5 dpf. At 4.5 dpf, the chemicals were washed away and EdU was added from 4.5 to 5.5 dpf for cell cycle analysis. The positions of the EdU+ NRCs are indicated by white outlines. This brief period of LY411575 treatment was sufficient to induce cell cycle entry in the majority of NRCs compared with controls. (C) Average percentage of EdU+ NRCs in A and B (±s.d.). Forty Tg(Tp1:H2BmCherry)+ cells per larva were counted, starting from the posterior part of the pancreas (n=12 larvae for DMSO and n=12 larvae for LY411575). In DMSO controls, on average 23% of the NRCs were EdU+, whereas in LY411575-treated larvae an average of 69% were EdU+ (P<0.001). (D-F) Tg(Tp1:H2BmCherry); Tg(neurod:EGFP) larvae were treated with (D) DMSO or (E,F) 10 μM LY411575. (E) Larvae treated with LY411575 from 4 to 4.5 dpf. At 4.5 dpf, LY411575 was washed away and the animals were allowed to develop until 7 dpf. On average, 12 endocrine cells were present posterior to the PI (s.d.=4 cells, n=8 larvae), which translates into <14% of the NRCs in the pancreatic tail differentiating into the endocrine lineage. DMSO controls showed on average 1 endocrine cell (s.d.=1 cell, n=7 larvae). Arrowheads indicate NRC-derived endocrine cells. Arrows indicate Tg(neurod:EGFP)+ cells in the gut. (F) Larvae treated with LY411575 from 4 to 7 dpf. White arrowheads indicate three new islets composed of numerous endocrine cells. Only two NRCs did not undergo endocrine differentiation (yellow arrowheads). (G-H2) To induce moderate Notch signaling downregulation, Tg(Tp1:H2BmCherry); Tg(neurod:EGFP) larvae were treated with (G) DMSO or (H,H2) 1 μM LY411575 from 4 to 7 dpf. In each case, the chemicals were replaced every 24 hours. Larvae treated with 1 μM LY411575 (H,H2) exhibited a significant increase in the total number of Tg(Tp1:H2BmCherry)+ cells posterior to the PI (yellow arrowheads) (118 cells, s.d.=21 cells, n=20 larvae) compared with DMSO controls (71 cells, s.d.=19 cells, n=18 larvae) (P<0.0001). NRC-derived endocrine cells represented, on average, 17% (s.d.=7.26%, n=19 larvae) of the total number of Tg(Tp1:H2BmCherry)+ cells posterior to the PI (white arrowheads) (see also supplementary material Fig. S5A,B,D for low-magnification views and data quantitation). All images are lateral views, anterior towards the top, ventral towards the right. Scale bars: 20 μm. (I) NRCs experience different levels of Notch signaling regulating their quiescent, proliferative or differentiation states. (J) Upon downregulation of Notch signaling, NRCs (red) enter the cell cycle. Under sustained downregulation of Notch signaling, they differentiate into endocrine cells and exit from the cell cycle. Some NRCs can differentiate directly without entering the cell cycle; some NRCs differentiate into endocrine cells even after a brief and/or a moderate level of Notch signaling downregulation. |
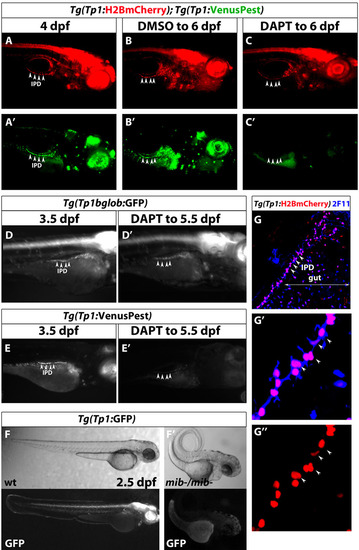
Notch signaling reporter lines based on the TP1bglob module. (A) Tg(Tp1:H2BmCherry) drives expression of H2BmCherry, which has a very long half-life, in NRCs. Tg(Tp1:VenusPest) drives expression of a destabilized VenusPEST fluorescent protein, which has a short half-life, in NRCs. (A-C) Tg(Tp1:H2BmCherry); Tg(Tp1:VenusPest) larvae were treated with DMSO or DAPT from 4 to 6 dpf. (B) DMSO-treated larvae are Tg(Tp1:H2BmCherry)+ and Tg(Tp1:VenusPest)+. (C) DAPT-treated larvae are Tg(Tp1:H2BmCherry)+ but strongly downregulate or even lose Tg(Tp1:VenusPest) expression in most tissues. Arrowheads indicate the IPD. (D,D2) An individual Tg(Tp1:GFP) larva was imaged at 3.5 dpf, incubated in DAPT until 5.5 dpf and imaged again. (E,E2) An individual Tg(Tp1:VenusPest) larva was imaged at 3.5 dpf, incubated in DAPT until 5.5 dpf and imaged again. Tg(Tp1:VenusPest) fluorescence is strongly downregulated compared with Tg(Tp1:GFP) fluorescence in D. Arrowheads indicate the IPD. (F) Embryos were obtained from an in-cross of mibta52b heterozygous parents. Wild-type Tg(Tp1:GFP) embryos at 2.5 dpf show strong Tg(Tp1:GFP) expression in multiple organs, whereas mib homozygous mutant embryos, recognized by their curly tail phenotype, failed to express Tg(Tp1:GFP). (G) Tg(Tp1:H2BmCherry) larvae were fixed at 7 dpf and stained for 2F11 (blue) to mark IPD cells (white arrowheads). The Tg(Tp1:H2BmCherry)+ cells (red) in the pancreas correspond to the 2F11+ IPD cells. 2F11+ and Tg(Tp1:H2BmCherry)+ cells ventral to the IPD are gut cells. All images are lateral views, anterior towards the right, ventral towards the bottom, except in F, where anterior is towards the top and ventral towards the right. |
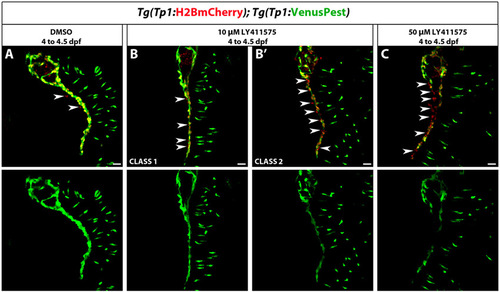
Analysis of Tg(Tp1:VenusPest) expression after a brief period of Notch signaling downregulation. Tg(Tp1:H2BmCherry); Tg(Tp1:VenusPest) larvae were treated with DMSO or LY411575 from 4 to 4.5 dpf. (A) In DMSO-treated larvae, the vast majority of pancreatic NRCs were Tg(Tp1:H2BmCherry)+ and Tg(Tp1:VenusPest)+. (B,B2) Larvae treated with 10 μM LY411575 showed variable donwregulation of Tg(Tp1:VenusPest) expression. (B) Seven out of 10 larvae (Class1) showed minor downregulation of Tg(Tp1:VenusPest) expression. In these larvae, only some Tg(Tp1:H2BmCherry)+ were Tg(Tp1:VenusPest)- (white arrowheads). (B2) Three out of 10 larvae (Class 2) exhibited significant downregulation of Tg(Tp1:VenusPest) expression and multiple Tg(Tp1:H2BmCherry)+ were Tg(Tp1:VenusPest)- compared with DMSO controls (white arrowheads). (C) Larvae treated with 50 μM LY411575 showed consistent downregulation of Tg(Tp1:VenusPest) expression compared with DMSO controls. In these larvae, many Tg(Tp1:H2BmCherry)+ cells were Tg(Tp1:VenusPest)- (white arrowheads). All images are lateral views, anterior towards the top, ventral towards the right; white arrowheads indicate the IPD. The NRCs ventral to the IPD are gut cells. Scale bars: 20 μm. |
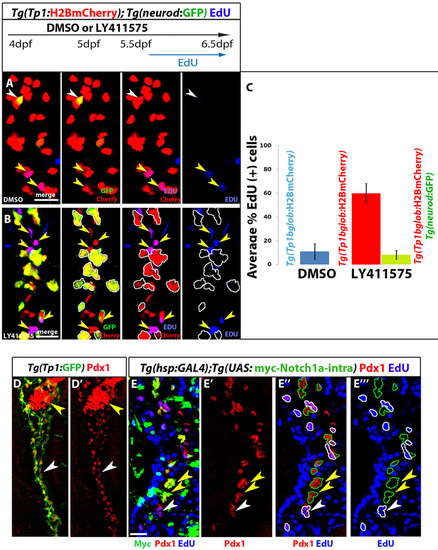
Endocrine differentiation of NRCs leads to cell cycle exit; NICD overexpression inhibits cell cycle progression. (A-C) Tg(Tp1:H2BmCherry); Tg(neurod:EGFP) larvae were used to label NRCs (red) and follow endocrine differentiation (green). (A-C) Larvae treated with DMSO or 10 μM LY411575 from 4 to 6.5 dpf (60 hours); EdU was added after a 36-hour delay (5.5 to 6.5 dpf). (A) DMSO-treated control larvae. Yellow arrowheads indicate EdU+ NRCs and white arrowheads indicate one endocrine cell along the IPD (projection of several planes). (B) LY411575-treated larvae show an increase in the number of new endocrine cells (green and red). For clarity, the positions of the endocrine cells are indicated by white outlines. Note that these endocrine cells are EdU-. EdU incorporation, however, can be observed in the NRCs that do not undergo endocrine differentiation (yellow arrowheads) (projection of several planes). (C) Quantification of average proportion of EdU+ cells for A and B. Blue bar: on average 11% of NRCs in DMSO controls were EdU+ (100 cells counted in 5 larvae). Red bar: in LY411575-treated larvae, on average 60% of NRCs not undergoing endocrine conversion were EdU+ (140 cells counted in 7 larvae) (P<0.001). Green bar: only 8% of new endocrine cells were EdU+ (182 cells counted in 4 larvae), indicating that endocrine differentiation leads to a proliferation block. (D) Tg(Tp1:eGFP) larvae were fixed at 4.5 dpf and stained for Pdx1. Pdx1 immunoreactivity is high in the endocrine cells in the PI (yellow arrowhead). Tg(Tp1:eGFP)+ NRCs extending posterior to the PI can be clearly identified based on Pdx1 immunoreactivity (white arrowheads). (E) Larvae obtained from crossing hemizygous Tg(hsp:Gal4) to hemizygous Tg(UAS:myc-Notch1a-intra) parents. Pdx1 immunoreactivity (red) marks NRCs. For clarity, all Myc+ NRCs (red and green) are outlined in green in E22 and E222. Yellow arrowheads indicate several Myc+ NRCs. None of the Myc+ NRCs are EdU+, indicating cell cycle block. By contrast, many neighboring Myc- NRCs are EdU+ (for clarity outlined in white; a white arrowhead indicates several Myc- NRCs) (projection of several planes). We found that 2.5% (118 cells counted, n=9 larvae) of Myc+ NRCs were EdU+ and 49% of the Myc- NRCs were EdU+ (235 cells counted, n=9 larvae). All images are lateral views, anterior towards the top, ventral towards the right. Scale bars: 20 µm. Error bars: s.d. |
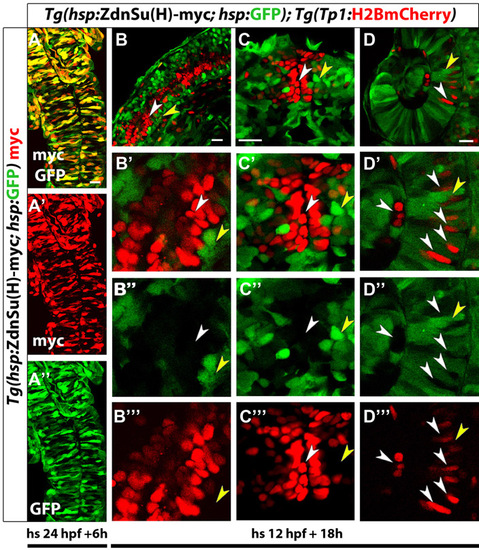
Validation of Tg(hsp:ZdnSu(H)-myc; hsp:GFP) as a tool for downregulation of Notch signaling. (A) Embryos obtained from in-crossing (Tg(hsp:ZdnSu(H)-myc; hsp:GFP) parents were heat shocked at 24 hpf, fixed at 30 hpf and stained for Myc. The majority of the cells in the neural tube co-express Myc and GFP (projection of several planes). (B-D) Embryos obtained from crossing Tg(hsp:ZdnSu(H)-myc; hsp:GFP) and Tg(Tp1:H2BmCherry) parents were heat shocked at 12 hpf and examined at 30 hpf for GFP and Tg(Tp1:H2BmCherry) expression. (B) A single plane through the neural tube. GFP+ cells show no or low expression of Tg(Tp1:H2BmCherry), indicating that they had impaired capacity to activate Notch signaling. To visualize the cells better, high-magnification single planes are shown in B2-B222. White arrowheads indicate individual Tg(Tp1:H2BmCherry)+ cells. Yellow arrowheads indicate individual GFP+ cells. Note that in most cases, the two cell types are mutually exclusive. Analogous observations were made in the brain (C) and retina (D). The images in A and C are dorsal views, anterior towards the top. The images in B and D are lateral views, anterior towards the top, ventral towards the right. Scale bars: 20 μm. |
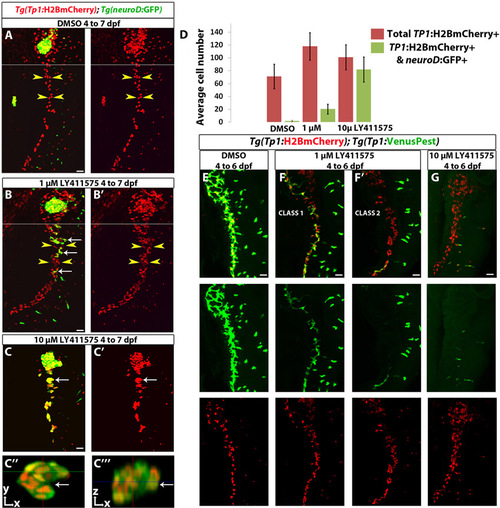
Behavior of NRCs under a moderate and a strong downregulation of Notch signaling. (A-C222) Tg(Tp1:H2BmCherry); Tg(neurod:EGFP) larvae were treated with (A) DMSO, (B) 1 μM LY411575 and (C) 10 μM LY411575. The chemicals were replaced every 24 hours. Compared with DMSO controls, the larvae treated with 1 μM LY411575 exhibited increased numbers of Tg(Tp1:H2BmCherry)+ cells (yellow arrowheads). A small proportion of the NRCs differentiated into endocrine cells, as assessed by Tg(neurod:EGFP) expression (white arrows). A and B show low-magnification projections corresponding to Fig. 4G,H, respectively. (C) In the larvae treated with 10 μM LY411575, the majority of Tg(Tp1:H2BmCherry)+ cells differentiated into endocrine cells, as assessed by Tg(neurod:EGFP) expression. (C22) To better visualize these endocrine cells, a high-magnification single plane through one of the secondary islets (white arrow in C and C2) is shown. (C222) Orthogonal view (z-axis) through the islet across the green line in C22. Note that this cell cluster spans several cell-layers. (D) Quantification of the average number of Tg(Tp1:H2BmCherry)+ cells (red bars) and Tg(Tp1:H2BmCherry); Tg(neurod:EGFP) double-positive cells (green bars) from the experiments in A-C. Tg(Tp1:H2BmCherry)+ and Tg(neurod:EGFP)+ cells posterior to the PI were counted. Larvae treated with 1 μM LY411575 exhibited a significant increase in the total number of Tg(Tp1:H2BmCherry)+ posterior to the PI (118 cells, s.d.=21 cells, n=20 larvae) compared with DMSO controls (71 cells, s.d.=19 cells, n=18 larvae) (P<0.0001); and in these larvae, NRC-derived endocrine cells represented on average 17% (s.d.=7.26%, n=19 larvae) of the total number of NRCs posterior to the PI. In larvae treated with 10 μM LY411575, NRC-derived endocrine cells represented on average 79% (s.d.=12%, n=14 larvae) of the total number of Tg(Tp1:H2BmCherry)+ cells posterior to the PI. These larvae exhibited a more modest increase in the average number of Tg(Tp1:H2BmCherry)+ posterior to the PI (101 cells, s.d.=19.5 cells, n=14 larvae) compared with DMSO controls (P<0.001). (E-G) Tg(Tp1:H2BmCherry); Tg(Tp1:VenusPest) larvae were treated with (E) DMSO, (F) 1 μM LY411575 and (G) 10 μM LY411575 from 4 to 6 dpf. The chemicals were replaced after 24 hours. (E) In the DMSO-treated larvae, the vast majority of NRCs are Tg(Tp1:H2BmCherry)+ and Tg(Tp1:VenusPest)+. (F-F2) In 12 out of 20 larvae treated with 1 μM LY411575 (Class 1), a significant proportion of Tg(Tp1:H2BmCherry)+ cells retained Tg(Tp1:VenusPest) expression, albeit at lower levels compared with DMSO controls. In the rest of the larvae (Class 2), only few Tg(Tp1:H2BmCherry)+ cells retained Tg(Tp1:VenusPest) signal. (G) Larvae treated with 10 µM LY411575 showed complete loss of Tg(Tp1:VenusPest) expression in the pancreatic Tg(Tp1:H2BmCherry)+ cells. All images are lateral views, anterior towards the top, ventral towards the right. Two fields of view were combined, as indicated by a white line to display the full length of the pancreas in A,B. Scale bars: 20 μm. Error bars indicate s.d. |