
- Title
-
Circadian timing of injury-induced cell proliferation in zebrafish
- Authors
- Idda, M.L., Kage, E., Lopez-Olmedam, J.F., Mracek, P., Foulkes, N.S., and Vallone, D.
- Source
- Full text @ PLoS One
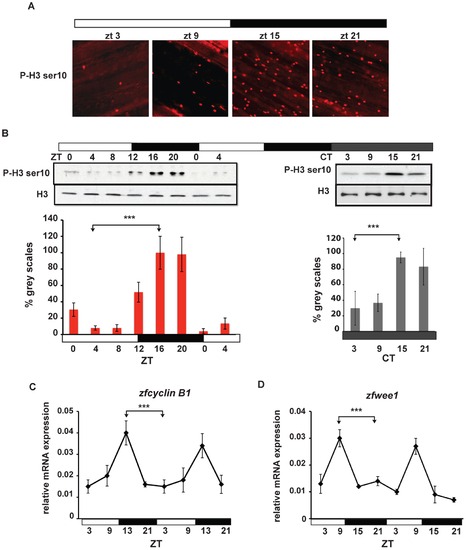
Circadian rhythms of M-phase in zebrafish fins. (A) Immunofluorescence of representative adult caudal fins stained using a phospho Histone H3 Ser 10 (P-H3 ser10) primary antibody at different zeitgeber times. (B) Western blot analysis and quantification of fin whole protein extracts in LD (left panel) and after 1 day in DD (right panel) using Histone H3 (H3) and P-H3 ser10 antibodies. On the Y-axis is plotted the values of grey-scale quantification using Scion Image software and calculated as % relative to the peak timepoint (ZT16 and CT15 respectively). (C,D) Quantitative RT-PCR analysis of two mitotic markers: zfcyclin B1 (C) and zfwee1 (D). In all experiments, the time points are indicated either as zeitgeber time (ZT) or circadian time (CT). White and black bars below each panel indicate the corresponding lighting conditions. Each experiment was performed in triplicate with a minimum of 4 fins (n = 4) for each timepoint. Data are plotted as means +/- SEM of three independent experiments. The results of statistical analysis are indicated above each graph by asterisks (Bonferroni′s post hoc test p<0.0001) and horizontal “brackets” drawn between the peak and trough values analyzed. All the quantitative data were subjected to Cosinor analysis to test for the presence or absence of 24-h rhythmicity (see Table S1, Figure S2). |
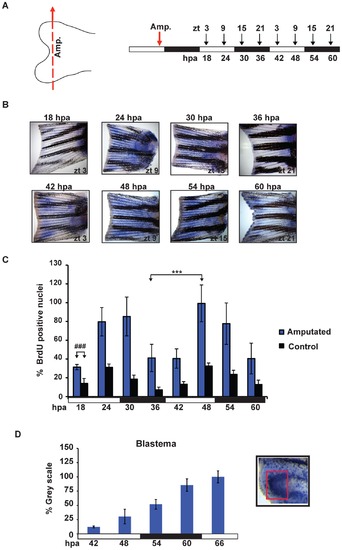
Amputation differentially induces cell proliferation. (A) Schematic representation of the experimental plan showing the amputation site (left panel), the times of sampling (ZT, right panel,,above) and the corresponding hours post amputation (hpa, right panel, below). Amputation was performed before the light-dark transition (ZT 9, red arrow) and fins were subsequently harvested every 6 hours (starting from 18 hpa). Each time point was collected following a 15 minutes incubation with BrdU. (B) Representative fins stained for BrdU incorporation at the time points indicated in panel A. (C) Quantification of the number of S-phase nuclei in amputated fins (blue bars) and non-amputated controls (black bars). On the Y-axis is plotted the % of BrdU positive nuclei with respect to the sample with the largest value (amputated, 48 hpa). The result of statistical analysis of the peak and trough values for the amputated fins is indicated by asterisks (Bonferroni′s post hoc test p<0.0001) and horizontal “brackets” above the graph. Furthermore, statistically significant differences observed at each time point between the amputated and control non-amputated fins are indicated for simplicity, by the symbol “#” and a bracket above only the first time point (18 hpa) (Bonferroni′s post hoc test p<0.0001, ###). (D) Quantification of the level of BrdU staining at the ray tips in the blastema region using Scion Image software. Inset panel (D): magnified view of the fin ray tips region stained for BrdU incorporation. A red square delimits the area that has been quantified. White and black bars below each panel indicate the light and dark periods. All the quantitative data were subjected to Cosinor analysis to test for the presence or absence of 24-h rhythmicity (see Table S1, Figure S2). Each time point represents the mean values calculated for each fin ray in a total of n = 4 to 6 fins and expressed as % of the grey scale value. |
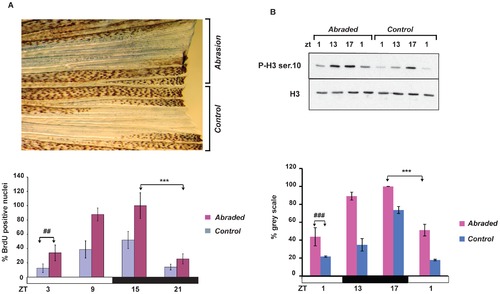
Mechanical abrasion increases circadian cell proliferation. (A), Upper section: Representative image of BrdU-stained caudal fin 48 hours after half of its surface was abraded. The remaining, non-treated half of the fin served as an internal control. Lower section: The results of quantification of the number of BrdU positive nuclei measured each 6 hours during one 24 hours period between 24 and 48 hours following abrasion performed at ZT3. On the Y-axis is plotted the % of BrdU positive nuclei with respect to the largest value (ZT15, abraded). (B) Western blot analysis using P-H3 Ser 10 and H3 antibodies and its quantification (below) of whole protein extracts prepared from the abraded and non-abraded (control) sections of fins. On the Y-axis is plotted the % of grey scale with respect to the highest value (ZT17, abraded). The precise times of sample preparation are indicated by ZT times. Each time point represents the mean value +/ SEM calculated for a minimum of n = 6 fish. The results of statistical analysis of the peak and trough values for the abraded fins are indicated by asterisks (Bonferroni′s post hoc test p<0.0001) and horizontal “brackets” above the graphs (A and B). Furthermore, statistically significant differences observed at each time point between the abraded and non-abraded control fins are indicated for simplicity, by the symbol “#” and a bracket above only the first time point (panel A, Bonferroni′s post hoc test p<0.001 and panel B, Bonferroni′s post hoc test p<0.0001). Black and white bars represent the dark and light periods. All the quantitative data were subjected to Cosinor analysis to test for the presence or absence of 24-h rhythmicity (see Table S1, Figure S2). |
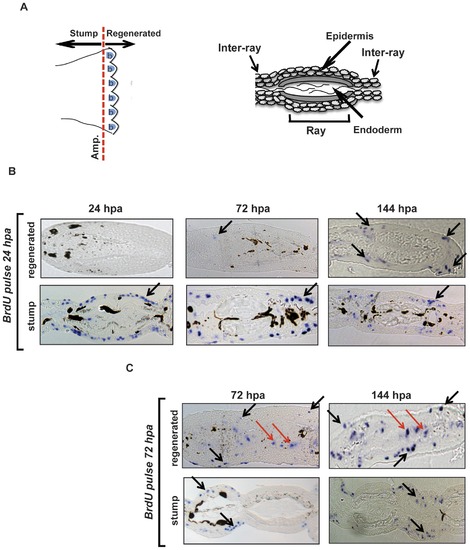
Early proliferating cells contribute to the formation of the new epidermis. (A) Left section: Schematic cartoon of an adult zebrafish caudal fin where the amputation site is indicated (Amp.) and the location of the stump and blastema (b) regions is defined. Right section: Schematic diagram of a transverse section through the zebrafish adult caudal fin. The identity of the principal structures is indicated. (B) Transverse sections of fins that 24 hours following amputation were labeled for 15 minutes with BrdU and then sampled at 24, 72 and 144 hpa. Histological sections through the tip of the new regenerating fin tissue (regenerated) and through the “original” portion of the fin (stump) are represented. Representative blue stained BrdU positive nuclei are indicated by black arrows and are predominantly restricted to the epidermal layers of the stump at all time points and in the regenerated epidermis at 72–144 hpa. (C) Sections from a comparable experiment to that presented in panel B, except that the 15 minutes BrdU labeling period was performed 72 hours after amputation. BrdU positive nuclei are visible in both epidermis (black arrows) and in the blastema region (red arrows) at all time points in the regenerating tissue. |
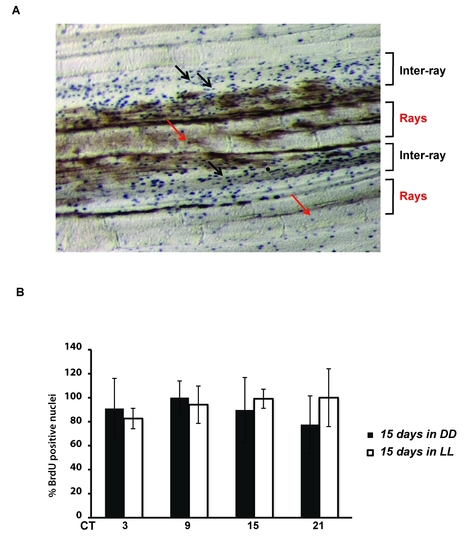
Loss of BrdU incorporation rhythms under constant conditions. (A) Representative image of BrdU staining of zebrafish caudal fin under LD conditions at ZT 9. BrdU positive nuclei (blue spots) in the inter-ray regions are indicated by black arrows. Red arrows indicate the few BrdU positive nuclei in the ray regions of the fin. (B) BrdU incorporation assays of fins sampled from fish maintained for 15 days under constant darkness (DD, black bars) or constant light (LL, white bars) and sampled at 6 hourly intervals during one subsequent 24 hours cycle (plotted as CT times). On the Y-axis is plotted the % of BrdU positive nuclei with respect to the largest value (DD, CT 9 and LL, CT15). Each time point represents the mean value +/- SEM calculated for a minimum of n = 6 fish. The data were subjected to Cosinor analysis to test for the absence of 24-h rhythmicity (see Table S1). |
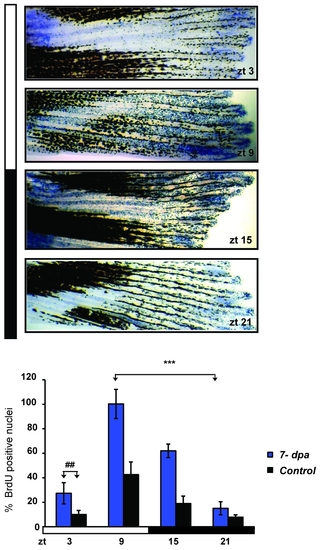
High amplitude circadian epithelial cell cycle rhythms persist during fin re-growth. Representative fin segments stained for BrdU incorporation at four zeitgeber times (ZT) distributed through one 24 hours cycle, starting 7 days post amputation (7 dpa). Below, quantification of the level of BrdU staining in fins amputated 7 days previously (blue bars) compared with non-amputated control fins (black bars). On the Y-axis is plotted the % of BrdU positive nuclei with respect to the largest value (ZT 9, 7 dpa). Each time point represents the mean value +/- SEM calculated for a total of n = 6 fins. The result of statistical analysis of the peak and trough values for the amputated fins is indicated by asterisks (Bonferroni′s post hoc test p<0.0001) and horizontal “brackets” above the graph. Furthermore, statistically significant differences observed at each time point between the amputated and non-amputated fins are indicated for simplicity, by the symbol “#” and a bracket above only the first time point (ZT3) (Bonferroni′s post hoc test p<0.001). White and black bars denote the light and dark periods respectively. The data were subjected to Cosinor analysis to test for the absence or presence of 24-h rhythmicity (see Table S1, Figure S2). |