
- Title
-
PhOTO Zebrafish: A Transgenic Resource for In Vivo Lineage Tracing during Development and Regeneration
- Authors
- Dempsey, W.P., Fraser, S.E., and Pantazis, P.
- Source
- Full text @ PLoS One
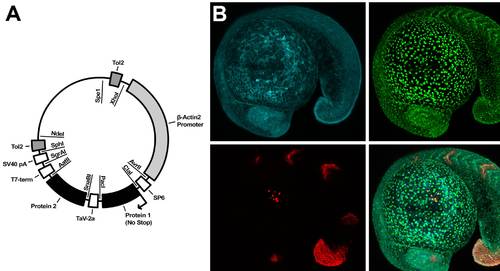
Description of PhOTO Vector and PhOTO Transgenics. (A) Depicted is a schematic of the general PhOTO vector. The major components of the vector, including the promoter, the TaV 2A sequence, the Tol2 transposable elements, and the protein locations are indicated on the outside of the plasmid circle. Each vector was designed such that each of the components (e.g. the promoter, the FPs, etc.) may be easily switched out for alternate protein fusions, etc. using the listed restriction enzymes (inside the circle) and an appropriate subcloning procedure. Note that the sizes of the blocked regions indicating coding sequences are not to scale. (B) Representative heterozygous PhOTO-N expression in an 18–19 hour post fertilization F1 transgenic zebrafish embryo. The top left panel of (B) depicts memb-Cerulean (blue); the top right panel depicts unconverted H2B-Dendra2 (green); the bottom left panel depicts photoconverted H2B-Dendra2 (red) in 4 somites, the tip of the tail, a subset of cells in the eye, and a subset of cells atop the yolk; and the bottom right panel depicts a merged image of all three colors. Scale bar is 100μm. |
Monitoring Dynamic Membrane Movements and Tracking Nuclei in a PhOTO-M Zebrafish During Gastrulation. Animal pole view maximum intensity projection (MIP) images of the first 21µm (in depth) of an ~5 hour time-lapse of a heterozygote F1 PhOTO-M zebrafish from late gastrulation (>80% epiboly) until early segmentation. (A) Merged MIP of the first frame of the time-lapse, showing unconverted (green) memb-Dendra2, segmented photoconverted (red) memb-Dendra2, and H2B-Cerulean (blue) labeled nuclei as well as segmented H2B-Cerulean nuclei (multi-colored surfaces in the photoconverted cells). (B) Merged MIP image of the final frame of the time-lapse. (C) Zoomed MIP images of segmented, photoconverted, and migrating memb-Dendra2 intensity data (red) and segmented H2B-Cerulean nuclei (multi-colored surfaces) at 8 different time-points. Note that H2B-Cerulean was segmented using the surrounding membranes as a guide in three dimensions. Cells are migrating in front of the developing head and move apart laterally. Arrowheads depict a cell division event and the arrow depicts a cell moving into the field of view from below. Note that a few overlying enveloping layer (EVL) cells were photoconverted in addition to the tracked cells, but since these remained stationary throughout the time-lapse, they were neglected when performing semi-automated membrane segmentation of the data. Scale bars are 50μm. |
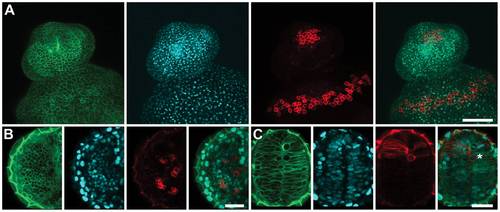
PhOTO-M Photoconversion Persists in Multiple Cell Types. Zebrafish were photoconverted in a <100µm circular region of interest near the animal pole during gastrulation and were imaged the following day to visualize cell membranes at high resolution in different cell compartments. Even after multiple rounds of division, photoconverted membranes are still clearly visible above background. (A) Photoconverted membranes are clearly visible in the epithelium a day after photoconversion. Maximum intensity projections of a ventrally mounted zebrafish (anterior top) embryo 1 day post fertilization. Left to Right: Unconverted memb-Dendra2 (green), H2B-Cerulean (blue), photoconverted memb-Dendra2 (red) and a merged image of the three channels. (B) Photoconverted membranes are visible and are separated by unconverted membranes in the eye a day after photoconversion. Single focal plane images of the developing eye in a ventrally mounted zebrafish (anterior top) embryo 1 day post fertilization. Left to Right: Unconverted memb-Dendra2 (green), H2B-Cerulean (blue), photoconverted memb-Dendra2 (red) and a merged image of the three channels. (C) Photoconverted membranes are visible in the developing forebrain a day after photoconversion. Single focal plane images of the developing forebrain in a ventrally mounted zebrafish (anterior top) embryo 1 day post fertilization. The star indicates an individual photoconverted cell in mitosis during prometaphase. Left to Right: Unconverted memb-Dendra2 (green), H2B-Cerulean (blue), photoconverted memb-Dendra2 (red) and a merged image of the three channels. Scale Bar in (A) is ~150μm. Scale Bar in (B) and (C) is ~30μm. |
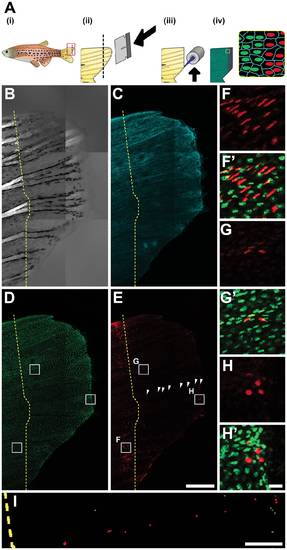
Photoconverted Cell Organization After Epimorphic Tail Fin Regeneration in a Living Adult PhOTO-N Zebrafish. (A) Overview of fin regeneration protocol. (i) An adult zebrafish is anesthetized and (ii) the tail is amputated using a razor blade (dotted line refers to amputation plane). (iii) Photoconversion is achieved by fluorescent illumination along the amputation plane. (iv) In addition to the H2B-Dendra2 (green) and memb-Cerulean (blue) signal, there is now a line of photoconverted H2B-Dendra2 nuclei (red). (B-I) Lateral view (anterior left, ventral down) MIP images of the regenerating tail fin of a live, anesthetized adult zebrafish 7 days post amputation. The dotted yellow line indicates the approximate amputation plane. (B) Bright field channel. Bright signal to the left of the dotted line arises from tissue birefringence. The terminal end of this signal indicates the amputation plane. (C) Memb-Cerulean (blue) and (D) unconverted H2B-Dendra2 (green) channels indicate that expression is still consistent as the tail fin regenerates. (E) Many of cells with fluorescence above background appear both before and after the plane of amputation in the photoconverted H2B-Dendra2 (red) channel. Cells in the central region of the tail show the least expression, suggesting extensive cell division contributing to regeneration in this area. However, certain cells to the right of the amputation plane are bright, aligned, and evenly spaced (arrowheads). (F-H) Zoomed boxed regions from (D) and (E) of photoconverted H2B-Dendra2 (red) alone. (F′-H′) Merged unconverted H2B-Dendra2 (green) and photoconverted H2B-Dendra2 (red) within the zoomed boxed regions from (D), (E). (F, F′) Many photoconverted cells in the ventral and dorsal portions of the amputated fin stayed behind the amputation plane during the regeneration process. (G, G′) Surprisingly, a subset of brightly photoconverted cells were found in the central portion in addition to (H, H′) other bright cells at the distal edge of the regenerate. (I) Zoomed binary image of a subset of the segmented nuclei from the photoconverted H2B-Dendra2 channel in panel (E). Among the scattered cells with photoconverted signal over background (gray), certain cells (red) seem aligned and evenly spaced along the anterior-posterior axis of the tail fin within the regenerating region. Scale bar for (B-E) is 300μm. Scale bar for (F-H) is ~10μm. Scale bar for (I) is ~100μm. |
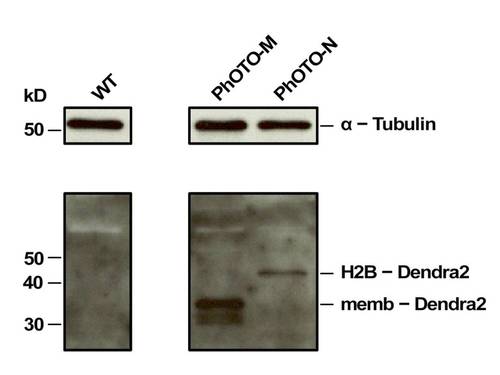
Efficient TaV2A-Mediated Protein Cleavage in the PhOTO Zebrafish Lines. Western blot analysis of each PhOTO line: lane (1) WT (2) PhOTO-M (3) PhOTO-N. The membrane was probed for Dendra2 as well as α-Tubulin (loading control, upper blot). No Dendra2 was seen in the WT (lane 1), and each PhOTO lane had the Dendra2 protein at approximately the molecular weight expected from the particular fusion protein. Note that for lane 2, two bands are present, reflecting the post-translational palmitoylation/myristoylation additions. Efficient protein cleavage as a result of the TaV 2A sequence was confirmed by the lack of an uncleaved product within the two PhOTO lanes. (absence of a band above 50kDa in the lower blot). |
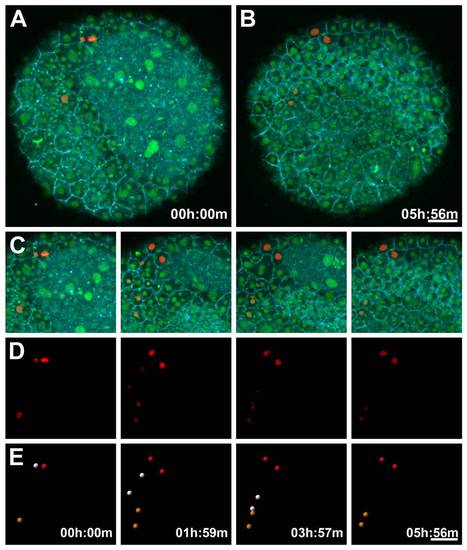
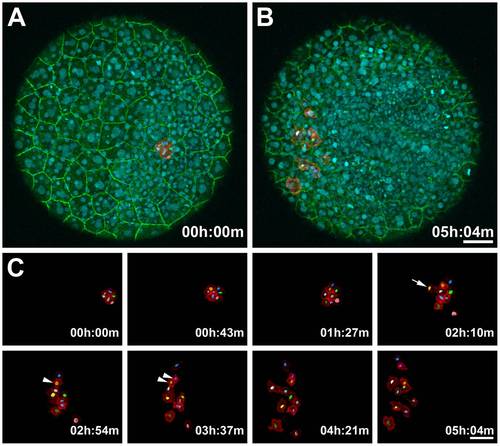
Nuclear Photoconversion and Segmentation in a PhOTO-N Zebrafish During Gastrulation. Animal pole view maximum intensity projection (MIP) images of the first 10.5μm (in depth from the animal pole) of an ~6 hour time-lapse of a heterozygote F1 PhOTO-N zebrafish from late gastrulation (>80% epiboly) until early segmentation. (A) Merged MIP of the first frame of the time-lapse, showing memb-Cerulean (blue) and both unconverted (green) and segmented photoconverted (red) H2B-Dendra2. (B) Merged MIP image of the final time frame of the time-lapse. (C) Zoomed in MIP areas at four different time-points of the merged fluorescence images as a reference for the photoconverted images seen in panels (D) and (E). (D) Intensity images from segmented photoconverted nuclei (red) for the same 4 timepoints as the merged image in panel (C). (E) Segmented nuclei from the intensity images from panel (D). Two enveloping layer (EVL) cells are photoconverted (the orange and red spheres) as well as an epiblast cell (the white sphere). Each cell undergoes a single cell division during the course of the time-lapse. Note that the epiblast cells move beneath the field of view in the last frame, due to the development of the head during early segmentation. Scale bars are 50μm. |
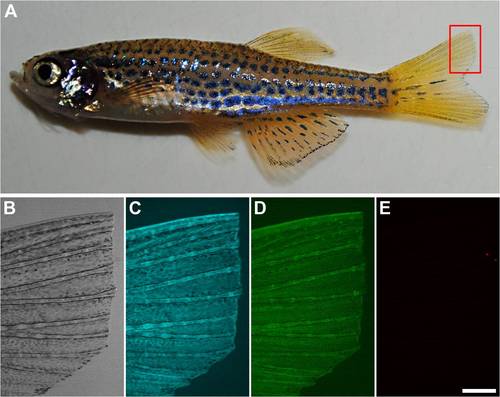
Amputation of Adult PhOTO-N Zebrafish Before Photoconversion. (A) A digital camera photo of the anesthetized PhOTO-N zebrafish after amputating a small portion of the upper half of the tail fin. (B–E) A fluorescent stereomicroscope image of the amputated tail fin (anterior left, ventral down) showing (B) bright field, (C) memb-Cerulean (blue), (D) unconverted H2B-Dendra2 (green), and (E) background signal when imaging with the same fluorescence emission filter as photoconverted H2B-Dendra2 (red). Note that there is almost no background fluorescent signal in (E), except for a small bit of detritus in the water that is picked up in the red fluorescence channel. Scale bar for (B–E) is ~300μm. |
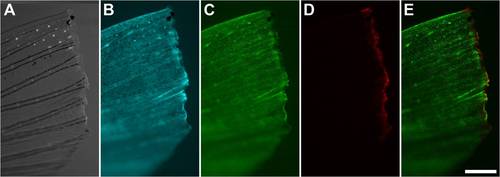
Amputated Adult PhOTO-N Zebrafish Tail Fin After Photoconversion. A fluorescent stereomicroscope image of the photoconverted amputated tail fin (anterior left, ventral down) showing (A) bright field, (B) memb-Cerulean (blue), (C) unconverted H2B-Dendra2 (green), (D) photoconverted H2B-Dendra2 (red), and (E) a merged image of (C) and (D). Note that almost all of the H2B-Dendra2 fluorescence has been photoconverted in the ~50–100μm region along the amputation plane, as is indicated by the lack of green signal in the photoconverted stripe in (C). Scale bar is ~300μm. |