
- Title
-
Evolution of the osteoblast: Skeletogenesis in gar and zebrafish
- Authors
- Eames, B.F., Amores, A., Yan, Y.L., and Postlethwait, J.H.
- Source
- Full text @ BMC Evol. Biol.
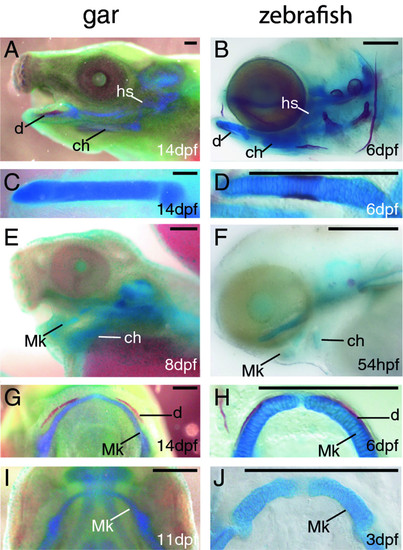
Temporal series of skeletal preparations reveal early and late stages of cartilage and bone development in gar and zebrafish. A-J, Alcian blue (cartilage)/Alizarin red (mineralized bone) stained fish larvae. Lateral images of larval head skeletons show that many cartilage and a few bone elements were well-formed by 14 dpf in gar (A) and by 6 dpf in zebrafish (B). Dissected and flat-mounted ceratohyals of 14 dpf gar (C) and 6 dpf zebrafish (D) showed strong Alcian blue staining and distinct boundaries of the skeletal element, which are two features of well-developed cartilage. At earlier stages, more faint and diffuse Alcian blue staining was apparent in developing ceratohyal condensations of 8 dpf gar (E) and 54 hpf zebrafish (F). Ventral views show obvious Alizarin red staining of the dentary along anterolateral aspects of Meckel′s cartilage in the lower jaws of 14 dpf gar (G) and 6 dpf zebrafish (H). At earlier timepoints, no Alizarin red staining was visible in regions of the dentary in 11 dpf gar (I) and 3 dpf zebrafish (J). Scale bars: A-J = 0.25 mm. Abbreviations: ch = ceratohyal; d = dentary; dpf = days post-fertilization; hpf = hours post-fertilization; hs = hyosymplectic; Mk = Meckel′s. |
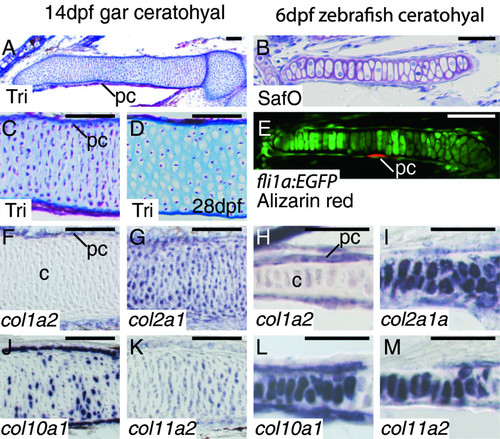
Collagen expression is equivalent in chondrocytes of gar and zebrafish. A, C, D, Trichrome-stained coronal gar sections. B, Safranin O-stained coronal zebrafish section. E, confocal slice of ceratohyal in fli1a:EGFP zebrafish, which have GFP expression in skeletogenic neural crest cells [47] and Alizarin red staining of calcified bone matrix. F-M, in situ hybridization on coronal sections. Trichrome staining of the 14 dpf gar ceratohyal (A) shows hundreds of chondrocytes, which had not yet undergone hypertrophy (B), and a thin layer of Aniline blue-stained bone matrix in the perichondrium. Mid-diaphyseal gar chondrocytes had undergone hypertrophy by 28 dpf (C). Safranin O staining identifies cartilage matrix of the 6 dpf zebrafish ceratohyal (B), while confocal imaging of fli1a:EGFP transgenic zebrafish ceratohyal (E) illustrates chondrocyte morphology and bone matrix deposition (Alizarin red) in the perichondrium. At these timepoints, chondrocytes in both gar and zebrafish failed to express col1a2 (F, H), whereas transcripts for col2a1 (G, I), col10a1 (J, L), and col11a2 (K, M) were detected in mid-diaphyseal mature chondrocytes. All of these collagen genes were expressed in developing perichondrium of both gar and zebrafish ceratohyal. Scale bars: A-M = 50 μm. Abbreviations: c = cartilage; dpf = days post-fertilization; pc = perichondrium; SafO = Safranin O; Tri = Trichrome. EXPRESSION / LABELING:
|
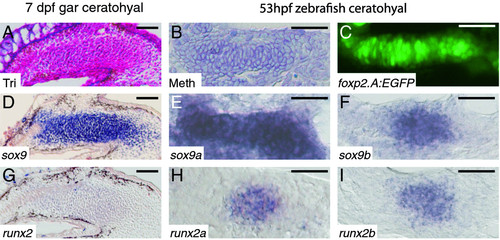
Chondrogenic condensations of gar and zebrafish display similar transcription factor expression patterns. A, Trichrome-stained coronal gar section. B, Methylene blue-stained coronal zebrafish section. C, confocal slice of foxp2.A:EGFP zebrafish, which express GFP in developing chondrocytes [45]. D-I, in situ hybridization on coronal sections. Trichrome staining of the 7 dpf gar ceratohyal (A) and Methylene blue staining of the 53 hpf zebrafish ceratohyal (B) show mesenchymal condensation. Confocal imaging of foxp2.A:EGFP transgenic zebrafish ceratohyal (C) illustrates condensation of chondrogenic cells at 53 hpf. Similar to expression of sox9 in the gar ceratohyal (D), zebrafish ceratohyal expressed both sox9a (E) and sox9b (F) co-orthologs. While transcripts for runx2 were slightly above background in the 7 dpf gar ceratohyal (G), both runx2a (H) and runx2b (I) co-orthologs were expressed highly in 53 hpf zebrafish ceratohyal. Scale bars: A-I = 30 µm. Abbreviations: dpf = days post-fertilization; hpf = hours post-fertilization; Meth = Methylene blue; Tri = Trichrome. EXPRESSION / LABELING:
|
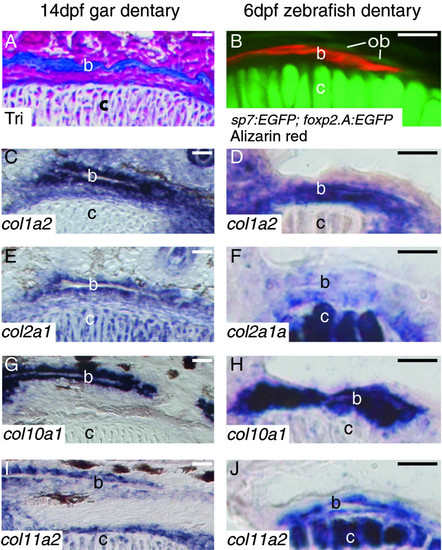
Collagen expression in osteoblasts of gar and zebrafish is equivalent. A, Trichrome-stained coronal gar section. B, confocal slice of sp7:EGFP; foxp2.A:EGFP zebrafish, which have GFP expression in both developing osteoblasts and developing chondrocytes, respectively [45, 46] and also are stained with Alizarin red to visualize mineralized bone matrix. C-J, in situ hybridization on coronal sections. Aniline blue staining in the 14 dpf gar (A) and Alizarin red staining in the 6 dpf zebrafish (B) reveals bone matrix of the dentary. Osteoblasts of the zebrafish dentary are labeled with the sp7:EGFP transgene. Osteoblasts of both the gar and zebrafish dentaries expressed col1a2 (C, D), col2a1 (E, F), col10a1 (G, H), and col11a2 (I, J), although expression of col2a1a in zebrafish osteoblasts was relatively lower than seen in gar osteoblasts. Scale bars: A-J = 15 µm. Abbreviations: b = bone; c = cartilage; dpf = days post-fertilization; ob = osteoblast; Tri = Trichrome. EXPRESSION / LABELING:
|
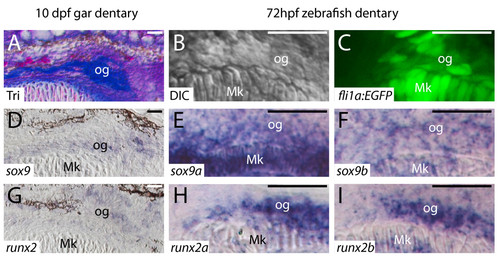
Transcription factor expression in osteogenic condensations of gar and zebrafish is equivalent. A, Trichrome-stained coronal gar section. B, Differential interference contrast image of zebrafish. C, confocal slice of fli1a:EGFP zebrafish. D-I, in situ hybridization on coronal sections. Osteogenic cells of the 10 dpf gar dentary have begun to secrete Aniline blue-stained bone matrix, but do not stain with Alizarin red, as this new matrix is uncalcified (data not shown). Osteogenic cells of the 72 hpf zebrafish dentary are located in an equivalent position. Similar to expression of sox9 in the gar dentary (D), the zebrafish dentary expressed both sox9a (E) and sox9b (F) co-orthologs. Osteogenic cells of the gar dentary expressed transcripts for runx2 (G), and osteogenic cells of the zebrafish dentary expressed both runx2a (H) and runx2b (I) co-orthologs. Scale bars: A-I = 20 μm. Abbreviations: DIC = differential interference contrast; dpf = days post-fertilization; hpf = hours post-fertilization; Mk = Meckel′s; og = osteogenic cells; Tri = Trichrome. EXPRESSION / LABELING:
|
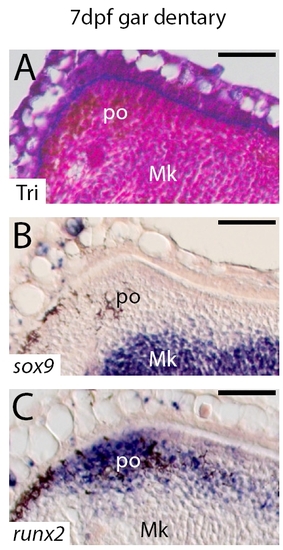
Transcription factor expression in pre-osteoblasts of gar. A, Trichrome-stained coronal section. B, C, in situ hybridization on coronal sections. Trichrome staining of 7 dpf gar (A) shows mesenchymal cells lateral to the condensation of Meckel′s cartilage. These pre-osteoblasts do not express sox9 (B), but express high levels of runx2 (C). Scale bars: A-C = 50 μm. Abbreviations: dpf = days post-fertilization; Mk = Meckel′s; po = pre-osteoblasts; Tri = Trichrome. |