
- Title
-
Conditions that influence the response to Fgf during otic placode induction
- Authors
- Padanad, M.S., Bhat, N., Guo, B., and Riley, B.B.
- Source
- Full text @ Dev. Biol.
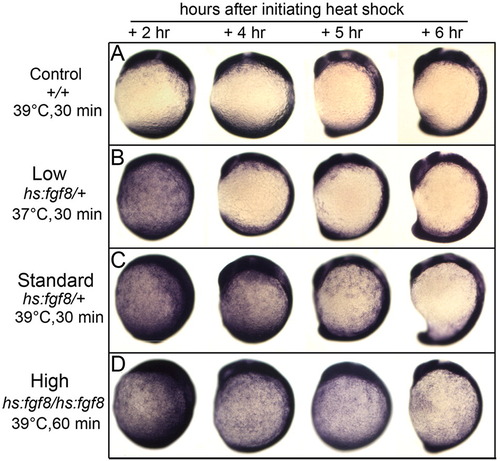
Expression of erm in response to differential activation of hs:fgf8. (A–D) Embryos were heat shocked at 10 hpf under conditions indicated to the left and fixed at times indicated across the top to examine expression of the Fgf-target gene erm. Images show lateral views with dorsal to the right and anterior up. |
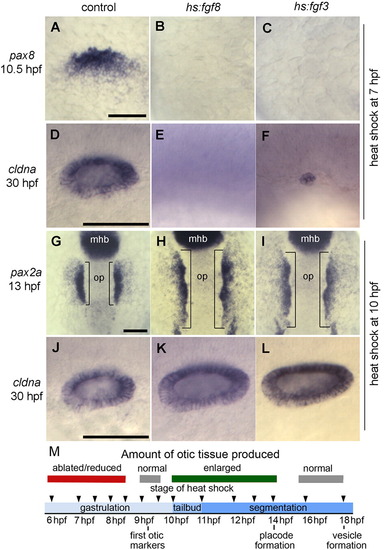
Stage-dependent effects of Fgf misexpression. (A–F) Embryos were heat shocked at 7 hpf and fixed at 10.5 hpf to examine expression of pax8 in the otic primordium (A–C) or 30 hpf to examine expression of cldna in the otic vesicle (D–F). (G–L) Embryos were heat shocked at 10 hpf and fixed at 13 hpf to examine otic expression of pax2a (G–I) or at 30 hpf to examine expression of cldna (J–L). Genotypes of wild-type controls and heterozygous transgenic embryos are indicated across the top of the figure. Images show lateral views with anterior to the left (A–F, J–L); dorsal views with anterior to the top (G–I). Scale bar, 50 μm. (M) Summary of the effects of activating hs:fgf8 at various developmental stages. |
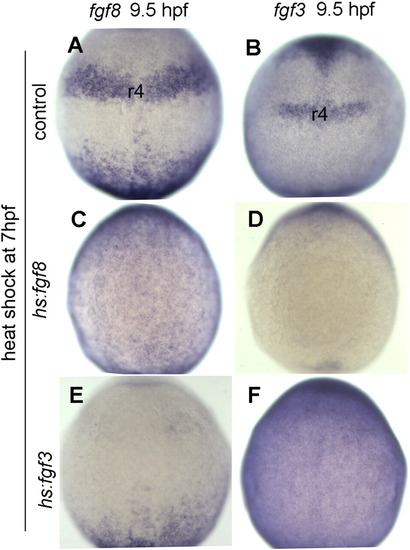
Misexpression of Fgf during gastrulation perturbs endogenous signaling centers. Expression of fgf8 and fgf3 in rhombomere 4 (r4) of hindbrain at 9.5 hpf in control embryos (A, B), hs:fgf8 transgenic embryos (C, D) and hs:fgf3 transgenic embryos (E, F) respectively. Embryos were heat shocked at 7 hpf. Note that fgf8 expression is still globally elevated in hs:fgf8/+ embryos whereas fgf3 is globally elevated in hs:fgf3/+ embryos, but fgf genes are not detectably upregulated in the r4 region. All images show dorsal views with anterior to the top. |
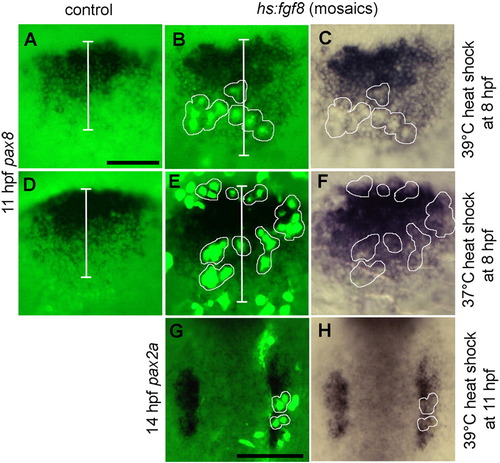
Effects of mosaic misexpression of Fgf8. (A–F) Lateral views (anterior to the left) showing expression of pax8 at 11 hpf in the otic domain in control embryos (A, D) or hs:fgf8/+ mosaic embryos (B, C, E, F) heat shocked at 39 °C (A–C) or 37 °C (D–F) at 8 hpf. Clusters of transgenic cells (green) are encircled with white borders to facilitate comparison of fluorescent images (B, E) with bright field images of the same specimens (C, F). White bars (A, B, D and E) mark the ML width of the otic domain. Note that transgenic cells express pax8 following heat shock at 37 °C but not at 39 °C, yet the otic domain is laterally expanded at both temperatures. (G, H) Dorsal views (anterior to the top) showing expression of pax2a at 14 hpf in a mosaic embryo heat shocked at 39 °C at 11 hpf. Transgenic cells (green, with white borders) express pax2a and the otic domain is lengthened along the AP axis. Scale bar, 150 μm. |
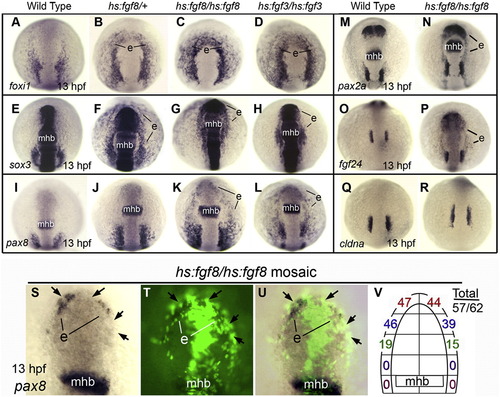
High level Fgf induces ectopic expression of otic markers in anterior preplacodal ectoderm after gastrulation. (A–R) Dorsal views (anterior up) of embryos heat shocked at 39 °C for 1 h starting at 10 hpf and then fixed at 13 hpf to examine expression of foxi1 (A–D), sox3 (E–H), pax8 (I–J), pax2a, (M, N), fgf24 (O, P) and cldna (Q, R). Genotypes of embryos are indicated across the top of the figure. The midbrain–hindbrain border (mhb) and regions showing ectopic expression (e) are indicated. (S–U) A representative hs:fgf8/hs:fgf8 mosaic embryo that was heat shocked at 39 °C for 1 h at 10 hpf and fixed at 13 hpf to examine pax8 expression. Images show the same specimen viewed under bright field (S), fluorescence (T), and an overlay (U). Positions of hs:fgf8/hs:fgf8 transgenic cells (green, black arrows), the midbrain–hindbrain border (mhb), and ectopic patches of pax8 expression (e) are indicated. (V) A summary diagram showing the number of hs:fgf8/hs:fgf8 mosaic embryos with ectopic expression of pax8 in different regions of the preplacodal ectoderm. The total number of mosaic embryos showing any ectopic pax8 divided by the total number examined is also indicated. |
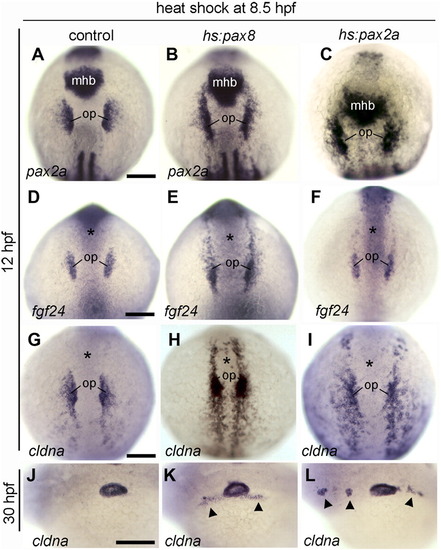
Expansion of otic markers following activation of hs:pax8 or hs:pax2a. (A–L) Dorsal views (anterior up) or lateral views (anterior to the left) of embryos heat shocked at 8.5 hpf and fixed at 12 hpf to examine expression of pax2a (A–C), fgf24 (D–F) and cldna (G–I), or embryos were fixed at 30 hpf to examine expression of cldna in the otic vesicle (J–L). Genotypes of wild-type or heterozygous transgenic embryos are indicated across the top of the figure. Expression in the otic placode (op) and midbrain–hindbrain border (mhb) is indicated. Alternatively, the position of the midbrain–hindbrain border is marked by an asterisk in (D–I). Arrowheads in K, L mark regions with ectopic expression of cldna. Scale bar, 150 μm. |
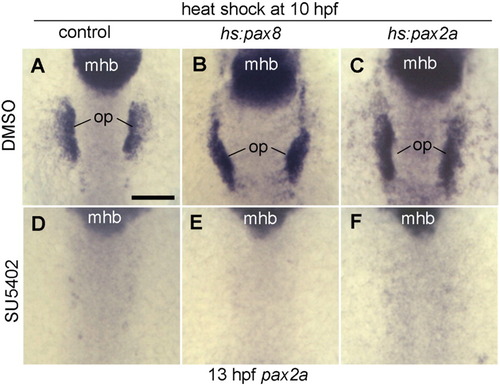
Pax2/8 misexpression cannot bypass the need for Fgf. (A–F) Dorsal views (anterior up) of pax2a expression at 13 hpf. Embryos were heat shocked at 10 hpf and then incubated in water containing 0.15% DMSO or 30 μM SU5402 and 0.15% DMSO. Genotypes of wild-type and heterozygous transgenic embryos are indicated across the top of the figure. Positions of midbrain–hindbrain boundary (mhb) and otic placode (op) are indicated. Scale bar, 150 μm. |

Formation of ectopic otic vesicles following co-misexpression of Fgf8 with Pax2a or Pax8. (A–I) Lateral views (anterior to the left) of embryos at 30 hpf, following heat shock at 10 hpf. Images show live embryos (A, B, I) or fixed specimens showing expression of cldna (C, D), otx1b (E), pax2a (F), dlx3b (G), or atoh1a (H). The specimen in (I) also carries brn3c:Gfp transgene to mark sensory hair cells. Embryos heterozygous for the indicated inducible transgenes are labeled across the top of the figure. Positions of the eye, midbrain–hindbrain border (mhb), endogenous otic vesicle (ov) and ectopic otic vesicles (arrowheads) are indicated. Scale bar, 50 μm. |
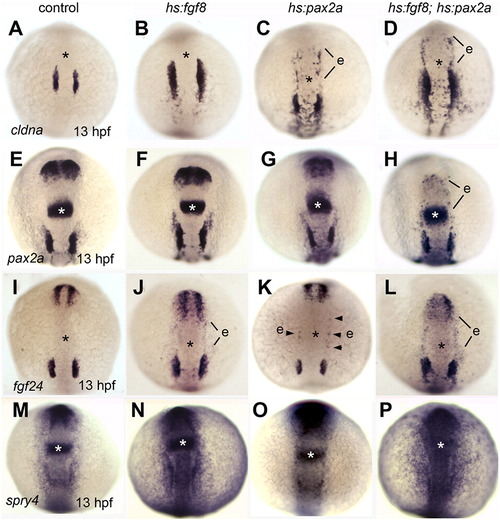
Effects of co-misexpression of Fgf8 with Pax2a on early otic development. (A–P) Dorsal views (anterior up) of embryos heat shocked at 10 hpf and fixed at 13 hpf to examine expression of cldna (A–D), pax2a (E–H), fgf24 (I–L) and spry4 (M–P). Genotypes of wild-type and heterozygous transgenic embryos are indicated across the top of the figure. The position of the midbrain–hindbrain border is marked with an asterisk. Regions with ectopic gene expression (e) are indicated. |
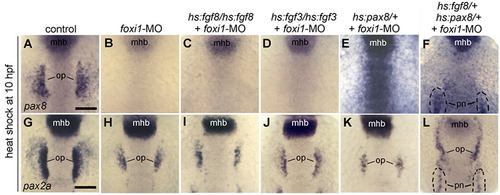
Misexpression of Fgf or Pax8 cannot expand otic development without Foxi1. (A–F) Expression of pax8 at 13 hpf. (G–L) Expression of pax2a at 13 hpf. Embryos were heat shocked at 10 hpf, and most embryos were injected at the one-cell stage with foxi1-MO (B–F, H–L) as indicated across the top of the figure. Genotypes of transgenic embryos, including hs:fgf8/hs:fgf8 (C, I), hs:fgf3/hs:fgf3 (D, J), hs:pax8/+ (E, K), and hs:fgf8/+; hs:pax8/+ (F, L) are indicated across the top of the figure. Positions of midbrain–hindbrain boundary (mhb), pronerphros (pn) and otic placode (op) are indicated. Note that the pronerphric domain of pax2a is also expanded anteriorly in double transgenic embryos (L). All images show dorsal views with anterior to the top. Scale bar, 150 μm. |
Reprinted from Developmental Biology, 364(1), Padanad, M.S., Bhat, N., Guo, B., and Riley, B.B., Conditions that influence the response to Fgf during otic placode induction, 1-10, Copyright (2012) with permission from Elsevier. Full text @ Dev. Biol.