
- Title
-
Kinesin-2 family in vertebrate ciliogenesis
- Authors
- Zhao, C., Omori, Y., Brodowska, K., Kovach, P., and Malicki, J.
- Source
- Full text @ Proc. Natl. Acad. Sci. USA

The jj203 mutant locus encodes the kif3b kinesin subunit. (A) Positional cloning of jj203 mutant locus. Top: Map of the jj203 genomic region and exon/intron structure of the kif3b transcript. Middle: Sequence of the jj203 transcript in WT and mutant animals. Bottom: Approximate diagram of Kif3b protein domain structure. Arrow indicates the site of the stop codon in the jj203 mutant allele. (B) The external phenotype of WT (Upper) and jj203 mutant (Lower) larvae at 5 dpf. (C-F′) Confocal images of WT (C, D, E, and F) and jj203 mutant (C′, D′, E′, and F′) larvae immunostained to visualize ciliogenesis in olfactory epithelium (C and C′), auditory maculae (D and D′), lateral line neuromasts (E and E′), and kidney tubules (F and F′) at 2 dpf (C and C′) or 3 dpf (D-F′). C-E′ show images of whole animals; F and F′ show transverse cryosections. (G-H′) Confocal images of olfactory pits (G and G′) and lateral line neuromasts (H and H′) in zebrafish larvae treated with anti-kif3b or with a control (CMO) antisense morpholino as indicated. (I and I′) Confocal images of anterior auditory maculae in jj203 mutants following overexpression of GFP (I) or kif3b (I′) mRNA. Larvae in C-I′ were stained with anti-acetylated tubulin antibodies (in green) and in some cases counterstained with phalloidin to visualize actin (red). Images in G-I′ were collected at 3 dpf. Arrows in C-I′ indicate cilia. |
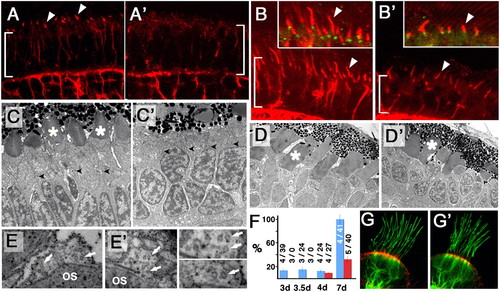
A subset of cilia differentiate in kif3b mutant embryos. (A, A′, B, and B′) Transverse cryosections through the photoreceptor cell layer (bracket) in WT (A and B) and jj203 mutant (A′ and B′) embryos stained with anti-acetylated tubulin antibody (red) at 3 dpf (A and A′) and 5 dpf (B and B′). (C and D′) EM images of sections through WT (C and D) and jj203 mutant (C′ and D′) photoreceptor cells at 3 dpf (C and C′) and 5 dpf (D and D′). (E and E′) EM images of sections perpendicular to outer segment (OS) microtubules in WT (E) and mutant (E′) photoreceptors. Arrows point to microtubule singlets. Enlargements are shown to the right: mutant (Upper) and WT (Lower). (F) The length of the connecting cilium in WT (blue bars) and mutant (red bars) retinae expressed as the percentage of WT length at 7 dpf. Measurements were performed on confocal images of transverse cryosections stained with anti-acetylated tubulin antibody. Data were collected at 3, 3.5, 4, and 7 dpf as indicated. Sample sizes (number of retinae/number of cilia) are provided. (G and G′) Confocal images of cilia in ear cristae of WT (G) or mutant (G′) embryos stained with anti-acetylated tubulin antibody (in green) and counterstained with phalloidin (in red) at 7 dpf. PHENOTYPE:
|
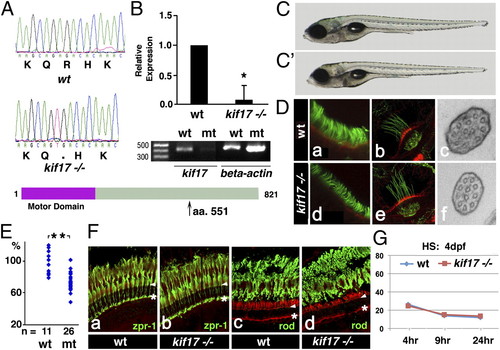
kif17 mutant phenotype. (A) Upper: Sequences of WT and kif17sa0119 mutant allele. Lower: Diagram of the Kif17 protein. Arrow indicates the site of the stop codon. (B) Upper: Quantitative RT-PCR. Expression level relative to WT is provided. Data were normalized for actin expression (P < 0.05). Lower: RT-PCR amplification of the kif17 transcript in WT and mutant embryos at 5 dpf. (C and C′) External phenotype of WT (C) and kif17sa0119 (C′) larvae at 7 dpf. (D) Confocal and ultrastructural analysis of cilia in WT and kif17sa0119 mutants. Larvae were stained with anti-acetylated tubulin antibody to visualize cilia in the nasal pit (a and d) and ear cristae (b and e). c and f, Ultrathin sections perpendicular to the distal tips of olfactory cilia in WT and mutant, respectively. (E) Graph showing the length distribution of nasal cilia in WT and kif17sa0119 mutants at 7 dpf. Each dot represents the average cilia length measured in a single individual. “n” is the number of individuals analyzed (P ≤ 0.001). (F) Confocal images of transverse cryosections through the retina of adult WT (a and c) and kif17 homozygous mutant (b and d) individuals stained with Zpr-1 (a and b) or anti-rod opsin (c and d) antibodies (green) and counterstained with phalloidin (red). Arrowheads indicate the outer limiting membrane, asterisks the outer plexiform layer. (G) Measurement of opsin transport efficiency from the inner to the outer segment in WT and kif17sa0119 mutant animals at 4 dpf. The intensity of GFP–opsin signal in the cell body is measured at 4, 9, and 24 h after heat shock. For each data point, 15 to 20 retinae, and 30 to 36 photoreceptors were analyzed. This experiment was performed as published (29) and illustrated in Fig. S1 (*P < 0.05; **P < 0.001). |
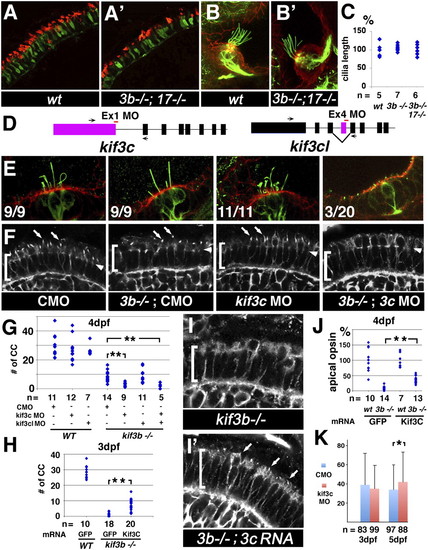
kif3c function in ciliogenesis. (A and A′) Confocal images of transverse cryosections through the retina stained with Zpr-1 (to visualize double cones; green), and anti-green opsin antibodies (red). (B and B′) Confocal images of lateral cristae in whole animals stained with anti-acetylated tubulin antibody to visualize kinocilia (green) and counterstained with phalloidin (red). WT and kif3bjj203-/-;kif17sa0119-/- double mutant animals were analyzed as indicated. (C) Cilia length in WT, mutant, and double mutant cristae as indicated. The average WT length is set at 100%. “n” is the number of individuals analyzed. (D) A schematic drawing of the exon/intron structure for the kif3c and kif3c-like genes. Morpholino-targeted exons are in color. Target sites are indicated as red horizontal bars. (E) Confocal images of lateral cristae in whole animals stained as in B. The number of individuals tested that differentiate cilia is indicated in lower left corner of each panel. (F) Confocal images of transverse cryosections through the retina stained with an anti-acetylated tubulin antibody to visualize cilia (arrows). For E and F, genotypes are indicated below. Brackets indicate the photoreceptor cell layer, arrowheads the outer limiting membrane. (G) The frequency of photoreceptor cilia at 4 dpf in different mutant/morphant backgrounds as indicated. (H) The frequency of photoreceptor cilia in kif3b-/- mutant homozygotes at 3 dpf, following rescue with kif3c or control GFP mRNA. In G and H, each dot represents the number of cilia per an arbitrary segment of the photoreceptor cell layer in a single retina. (I and I′) Confocal images of photoreceptor cilia (arrows) at 3 dpf visualized as in F. (J) Relative sizes of apical opsin-positive compartments (presumably outer segments) in kif3bjj203 homozygous mutant and phenotypically WT animals treated with kif3c or control GFP mRNA. Each dot represents the total size of apical opsin-positive domains on a single section through the retina, adjusted for the length of the photoreceptor cell layer. The average WT size equals 100%. (K) Efficiency of GFP–opsin transport in kif3c morphants measured as in Fig. S1. “n” is the number of photoreceptors analyzed. A minimum of 30 sections from six retinae were used to calculate each data point. In G, H, and J, “n” is the number of retinae analyzed. In all images, apical direction is up (*P < 0.05; **P < 0.001). EXPRESSION / LABELING:
PHENOTYPE:
|
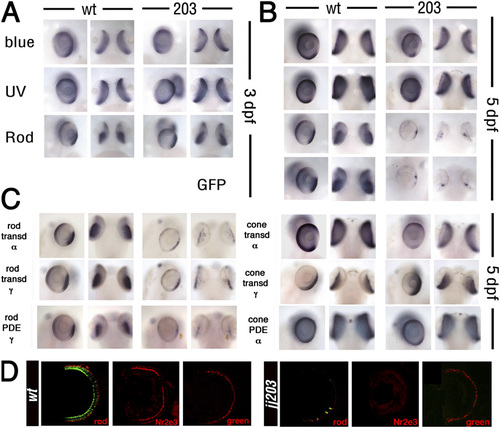
Rods die whereas cones survive in jj203 mutants. (A-C) Whole-mount in situ hybridization on WT and jj203 mutant embryos with probes to genes expressed in rods or cones at 3 dpf (A) or 5 dpf (B and C) as indicated. (D) Transverse cryosections through the central retina of WT (Left) and kif3bjj203 mutant (Right) larvae stained with anti-rod opsin, anti-Nr2e3, or anti-green cone opsin antibodies at 7 dpf (all in red) as indicated. The green channel (Left) shows GFP transgene expression driven by the Xenopus rod opsin promoter (2). EXPRESSION / LABELING:
|
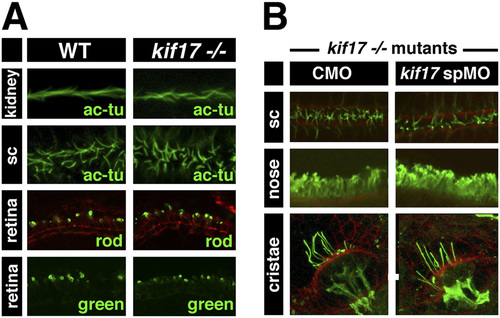
kif17 mutant phenotype. (A) Top two rows show confocal images of whole embryos stained with anti-acetylated tubulin antibody (green) to visualize cilia in the pronephric duct and the spinal canal (sc) at 30 hpf. Bottom two rows show confocal images of transverse cryosections through the retina at 5 dpf stained with anti-rod opsin or anti-green opsin antibodies (green). (B) Confocal images of kif17 mutant larvae at 3 dpf treated with control morpholino (CMO) or anti-splice kif17 morpholino as indicated. Larvae were stained with anti-acetylated tubulin antibody (green) to visualize cilia in the spinal canal, nasal pit, and ear cristae. When shown, red channel contains phalloidin staining. |