
- Title
-
Homeodomain protein otp and activity-dependent splicing modulate neuronal adaptation to stress
- Authors
- Amir-Zilberstein, L., Blechman, J., Sztainberg, Y., Norton, W.H., Reuveny, A., Borodovsky, N., Tahor, M., Bonkowsky, J.L., Bally-Cuif, L., Chen, A., and Levkowitz, G.
- Source
- Full text @ Neuron
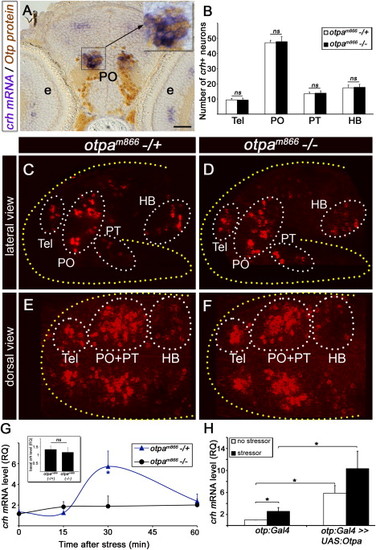
Otp Mediates Stress Response (A) Coronal sections (6 μm) through the PO showing colocalization of Otp and crh in a 6-day-old zebrafish larvae. Larvae were subjected to whole-mount in situ hybridization with a crh-directed probe followed by sectioning and immunostaining with an anti-Otp antibody. High magnification of the crh+;Otp+ area (black rectangle) is shown in the inset. (B) Histogram showing average cell counts in individual CRH+ neuronal clusters of a null zebrafish mutant allele, otpam866-/- (n = 20) compared to heterozygous otpam866-/+ siblings (n = 19). ns, not significant. (C–F) Projected confocal z stack images of CRH neurons in otpam866-/- (D and F) and otpam866-/+ siblings (C and E), acquired from lateral (C and D) and dorsal (E and F) angles. Neurons were visualized by fluorescent in situ hybridization of crh mRNA. (G) Induction of crh mRNA by homeostatic challenge. Physical stressor was applied to 6-day-old progenies of an otpam866-/+ cross for a period of 4 min. The amount of crh mRNA was measured in individual fish larvae at different time points of recovery using quantitative PCR (qPCR). Each tested larva was then genotyped by sequencing and crh mRNA levels of mutant (-/-) and heterozygous (-/+) animals were plotted accordingly. -p < 0.05; n = 8. (H) Gain of function of Otpa in Otp-positive neurons. Physical stress challenge was applied to either a transgenic otp:Gal4 embryos expressing Gal4 in Otp+ cells or their siblings, which were injected with a transposon-based plasmid vector containing the full-length cDNA encoding the otpa gene under the control of ten UAS elements (otp:Gal4 >> UAS:otpa). The amount of crh mRNA was measured using qPCR. -p < 0.05, n = 8. The following abbreviations are used: e, eye; HB, hindbrain; PO, preoptic area; PT, posterior tuberculum; RQ, relative quantity; Tel, telencephalon. Scale bar represents 50 μm in (A) and 100 μm in (C)–(F). |
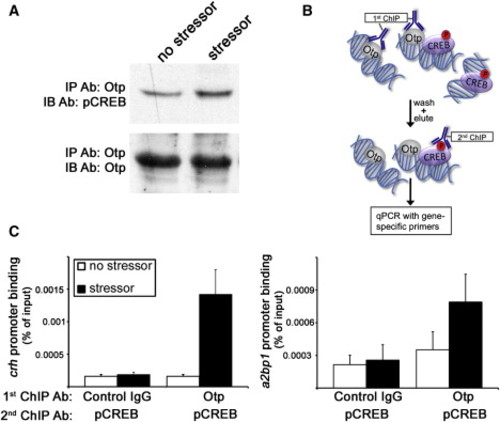
pCREB-Otp Protein Complex Is Recruited to crh and a2bp1 Promoters (A) A pool of 100 larvae per lane were subjected to stress challenges in bulk or left unchallenged. Larvae were lysed and subjected to IP with a resin-coupled anti-Otp antibody (Ab) followed by gel electrophoresis and protein electrotransfer to a membrane. Nitrocellulose filters were immunoblotted with an antibody directed to pCREB, stripped, and reblotted with an anti-Otp antibody. (B) Schematic representation of the sequential ChIP-reChIP procedure in which larvae lysates were first subjected to anti-Otp ChIP and the resulting Otp-DNA complex were eluted and subjected to a second ChIP with a pCREB antibody. (C) A pool of fish (300 larvae per lane) were subjected to stress challenges in bulk or left unchallenged followed by the ChIP-reChIP procedure using control IgG, anti-Otp, and anti-pCREB antibodies. The histograms show promoter co-occupancy analysis of Otp and pCREB (n = 2). |
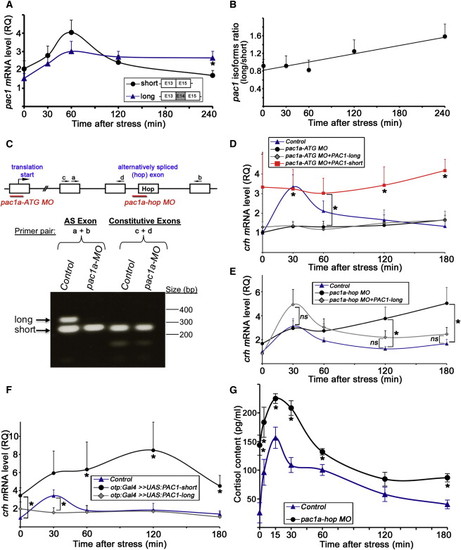
Modulation of Stress Response by Alternative Splicing of PAC1 (A) Quantitative PCR analysis of the two pac1 splice isoforms in mice that were subjected to a foot shock challenge. PVN punches were harvested at different time points following stress initiation. The analyzed pac1 cDNA fragments corresponding to the short and long (hop) splice isoform are schematically shown. The hop cassette is encoded by exon 14 (E14). -p < 0.05, n = 11. (B) Calculated ratio between the amounts of the long and short pac1 isoforms shown in (A) as a function of time after the initiation of the foot shock stressor showing a positive linear correlation. R2 = 0.9, n = 11. (C) The top part shows a scheme depicting pac1a gene structure including the respective binding sites for two antisense MO oligonucleotides designed either to block expression of both PAC1 isoforms (pac1a-ATG MO) or prevent the inclusion of the hop exon by alternative splicing (pac1a-hop MO). The bottom part shows a RT analysis of 6-day-old larvae showing the effect of the pac1a-hop MO. The long (hop) and short splice variants (arrows) are visualized in the control larvae, whereas only the short isoform is present in pac1a-hop MO-injected animals. Inclusion of adjacent constitutive exons is not affected by the pac1a-hop MO. (D–F) Quantitative PCR analyses of crh mRNA following a physical stress challenge of 6-day-old larva. The amount of crh mRNA was measured in individual fish larvae at different time points of recovery. (D) Stress challenge was applied to either mock-treated 6-day-old larvae (control, n = 14) or their siblings that were injected with antisense pac1a-ATG MO (n = 12), which prevents the formation of both PAC1 isoforms. Alternatively, transgenic otp:Gal4 embryos expressing Gal4 in Otp+ cells were coinjected with pac1a-ATG MO together with transposon-based vector constructs harboring PAC1′s short (pac1a-ATG MO+PAC1-short, n = 4) and long (pac1a-ATG MO+PAC1-long, n = 4) isoforms under the control of ten UAS elements (UAS:PAC1-short or UAS:PAC1-long, respectively). -p d 0.01. (E) Stress challenge was applied to either mock-treated 6-day-old transgenic otp:Gal4 larvae (control, n = 11) or their siblings, which were injected with a pac1a-hop MO (n = 12) or pac1a-ATG MO together with UAS:PAC1-long construct (pac1a-ATG MO+PAC1-long, n = 6). -p d 0.05. (F) Stress challenge was applied to either a otp:Gal4 transgenic line larvae (control, n = 10) or their siblings, which were injected with constructs containing the short (n = 7) or long (n = 6) PAC1 isoform under the control of ten UAS elements (otp:Gal4 >> UAS:PAC1-short or otp:Gal4 >> UAS:PAC1-long, respectively). The amount of crh mRNA was measured as described above. -p < 0.05. (G) Analysis of cortisol content following a physical stress challenge applied to either mock-treated 6-day-old larvae (control) or their siblings, which were injected with pac1a-hop MO. Whole-body cortisol levels were measured at different time points of recovery in tissue extracts derived from pools of ten larvae. -p < 0.05, n = 3. The following abbreviations are used: AS, alternative spliced exon; MO, morpholino; ns, not significant; RQ, relative quantity. |
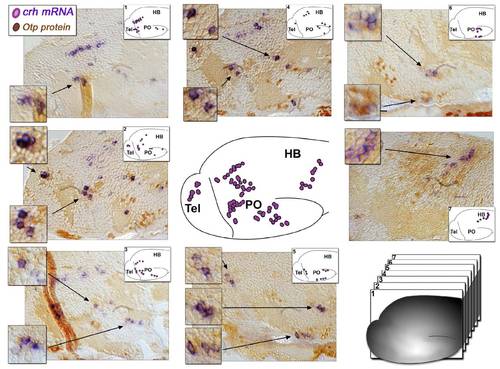
Expression of Otp and CRH in 6-day-old Zebrafish Larva, Related to Figure 1 Serial sagittal sections (6 μm) of 6-day old zebrafish larva subjected to whole mount in situ hybridization with a crh- directed probe (purple) followed by paraffin embedment and sectioning, antigen retrival and immuno-staining with an anti-Otp antibody (brown). The scheme in the center of the figure depicts the location of the major CRH+ neuronal clusters in 6-day old larva, whereas schemes shown in the insets of the image panels depict the subsets of CRH+ cells in each of the tissue sections. High-magnifications of crh+;Otp+ neuronal clusters (arrows) are also presented. |
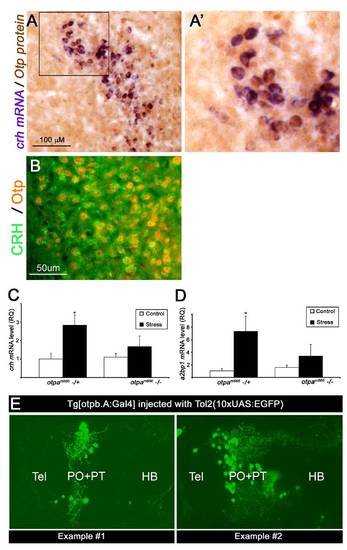
Expression of Otp and CRH in the Mouse PVN and Levels of Zebrafish crh in Response to Osmotic Challenge, Related to Figure 1 (A and B) Expression of Otp and CRH in the mouse PVN. Coronal sections through the adult mouse hypothalamus showing colocalization of Otp and crh in the mouse paraventricular nucleus. (A) Floating brain sections were subjected to in situ hybridization with a crh- directed probe followed by immuno-staining with an anti-Otp antibody. High-magnification of the crh+;Otp+ area (black rectangle) is shown in panel A′. (B) Double immuno-fluorescence staining with guinea pig anti-CRH antibogy (Bachem California, Torrance, USA) together with rabbit anti-Otp antibody, which was generated in our lab. (C and D) Attenuated osmotic stress response in otpam866 mutant. Osmotic stress challenge was applied to 6 day-old progenies of a otpam866-/+ cross by incubation in 50% artificial seawater for 4 min (See details in the Supporting Material). The amounts of crh (C, n=6) and a2bp1 (D, n=5) mRNAs were measured in control and stressed fish larvae using quantitative PCR (qPCR). Larvae were genotyped by sequencing and crh mRNA levels of mutant (-/-) and heterozygous (-/+) animals were plotted accordingly. *p<0.05. (E) Representative examples of otp:Gal4 transgenic line that was co-injected with transposon-based (Tol2) vector harboring EGFP under the control of UAS elements together with transposase mRNA. EGFP expression is readily visible in 6-day old larvae. |