
- Title
-
Mutation of zebrafish Snapc4 is associated with loss of the intrahepatic biliary network
- Authors
- Schaub, M., Nussbaum, J., Verkade, H., Ober, E.A., Stainier, D.Y., and Sakaguchi, T.F.
- Source
- Full text @ Dev. Biol.
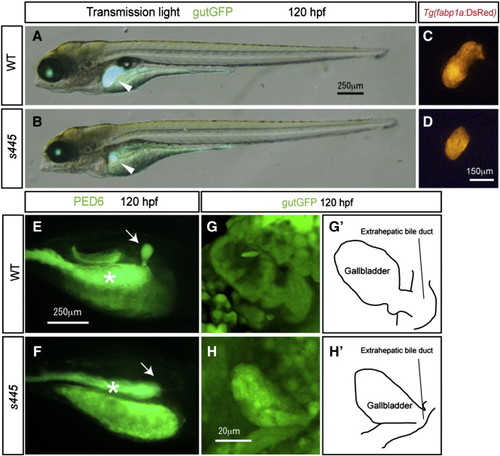
Morphological and physiological phenotypes of s445 mutant larvae at 120 hpf. (A and B) Bright-field images of wild-type (A) and s445 mutant (B) larvae at 120 hpf are overlaid with Tg(gutGFP)s854 expression (green). The physiological appearance of s445 mutant larvae is normal, however their liver size is smaller at 120 hpf. Lateral views, anterior to the left. White arrowheads point to the liver. (C and D) Fluorescent image of wild-type (C) and s445 mutant (D) Tg(fabp1a:DsRed)gz15 larvae at 120 hpf. Liver size visualized by Tg(fabp1a:DsRed)gz15 expression is smaller in s445 mutant larvae. Lateral views, anterior to the left. (E and F) Fluorescent images of wild-type (E) and s445 mutant (F) larvae soaked in PED6. PED6 is processed by phospholipase and fluorescence is detected in the intestine in both wild-type and s445 mutant larvae. However, PED6 fluorescence is missing from the s445 mutant gallbladder. Lateral views, anterior to the right. Asterisks indicate the intestine. (G and H) Projected confocal image of the gallbladders of wild-type (G) and s445 mutant (H) Tg(gutGFP)s854 larvae. The gallbladder and the extrahepatic bile duct visualized by Tg(gutGFP)s854 expression are schematically presented in (G2 and H2). Ventral views, anterior to the top. |
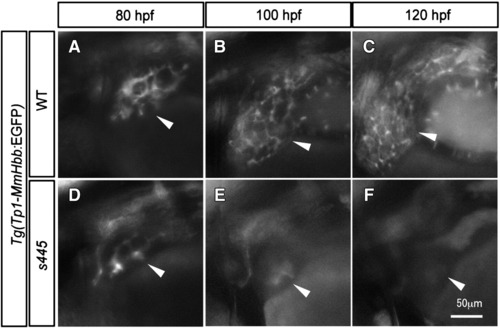
Time course observation of intrahepatic biliary network development. (A–C) Tg(Tp1-MmHbb:EGFP)um14 expression in the wild-type intrahepatic biliary network at 80 (A), 100 (B) and 120 (C) hpf; same larva is shown at all stages. (D–F) Tg(Tp1-MmHbb:EGFP)um14 expression in the s445 mutant intrahepatic biliary network at 80 (A), 100 (B) and 120 (C) hpf; same larva is shown at all stages. At 80 hpf, Tg(Tp1-MmHbb:EGFP)um14 expression in the s445 mutant intrahepatic biliary network is indistinguishable from that of wild-type, however it disappears after 100 hpf. Lateral views, anterior to the left. White arrowheads point to the liver in each image. EXPRESSION / LABELING:
PHENOTYPE:
|
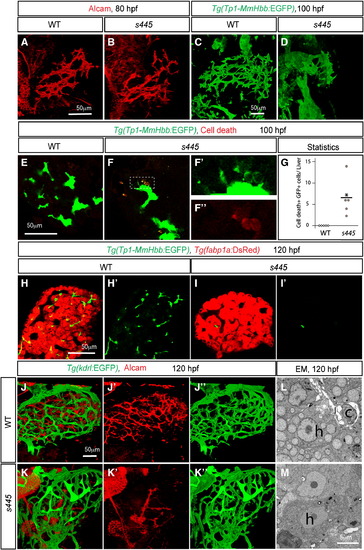
The intrahepatic biliary network disappears in s445 mutant larvae. Projected (A–D and J–K) and z-plane (E–F and H–I) confocal images of the liver at 80 (A and B), 100 (C–F) and 120 (H–K) hpf. Ventral views, anterior to the top. (A and B) Wild-type (A) and s445 mutant (B) larvae visualized for Alcam expression. The Alcam-positive intrahepatic biliary network in s445 mutant larvae is indistinguishable from that of wild-type at 80 hpf. (C and D) Wild-type (C) and s445 mutant (D) Tg(Tp1-MmHbb:EGFP)um14 larvae visualized for GFP expression. Tg(Tp1-MmHbb:EGFP)um14 expression in the liver is restricted to the intrahepatic biliary network at 100 hpf. The intrahepatic biliary network in s445 mutant appears to be degenerating at this stage. (E and F) Wild-type (E) and s445 mutant (F) Tg(Tp1-MmHbb:EGFP)um14 larvae stained for red fluorescent TUNEL. GFP expression and TUNEL signals in the outlined area are magnified and shown separately in F2 and F3, respectively. (G) Number of TUNEL positive Tg(Tp1-MmHbb:EGFP)um14 expressing cells in the wild-type (open square) and s445 mutant (closed circle) liver. *, p < 0.05. (H and I) Wild-type (H) and s445 (I) mutant Tg(Tp1-MmHbb:EGFP)um14; Tg(fabp1a:DsRed)gz15 larvae visualized for GFP and DsRed expressions. Tg(Tp1-MmHbb:EGFP)um14 expressing biliary epithelial cells have largely disappeared from s445 mutant livers by 120 hpf, while Tg(fabp1a:DsRed)gz15 expressing hepatocytes remain. GFP expression is shown separately in H2 and I2. (J and K) Wild-type (J) and s445 mutant (K) Tg(kdrl:EGFP)s843 larvae visualized for GFP (green) and Alcam (red) expressions. The Tg(kdrl:EGFP)s843-expressing intrahepatic vascular network is relatively unaffected while the Alcam-expressing intrahepatic biliary network is severely affected in s445 mutant larvae. Alcam and GFP expressions are shown separately in (J2 and K2) and (J3 and K3), respectively. (L and M) Electron micrographs of the wild-type (L) and s445 mutant (M) liver at 120 hpf. h, hepatocyte; c, cholangiocyte; l, the lumen of the cholangiocyte. EXPRESSION / LABELING:
PHENOTYPE:
|
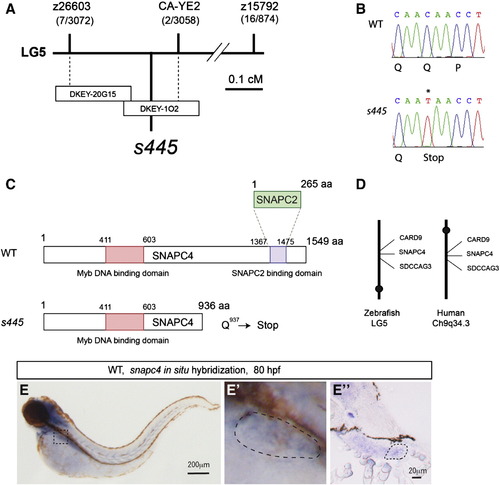
Positional cloning of the s445 mutant locus. (A) Schematic of the 445 locus. s445 is located on chromosome 5 in between two CA-repeat markers, z26603 (0.2 cM; 7 recombinants out of 3072 meioses) and CA-YE2 (0.07 cM; 2 recombinants out of 3056 meioses). The critical region of the s445 locus was spanned by two partially overlapping BAC clones, DKEY-20G15 and DKEY-1O2. (B) A single nucleotide mutation (C to T) that results in a premature stop of the snapc4 gene was identified in s445 mutants (0 recombinants out of > 3000 meioses). (C) Schematic of zebrafish Snapc4. Zebrafish Snapc4 contains a conserved Myb DNA binding domain and a Snapc2 binding domain. The s445 mutation generates a premature stop codon in the zebrafish snapc4 cDNA. The truncated mutant Snapc4 protein is approximately two-thirds the length of wild-type Snapc4 and lacks the Snapc2 binding domain. (D) s445 is located on zebrafish chromosome 5 in a region syntenic to a region of human chromosome 9q34.3. (E) Snapc4 expression in wild-type larvae at 80 hpf. snapc4 expression is detected in the liver at this stage. The outlined area is magnified and shown in E2. Lateral views, anterior to the left. Cross section of the stained larva in the region of the liver is shown in E3. The liver is outlined in E2 and E3. EXPRESSION / LABELING:
|
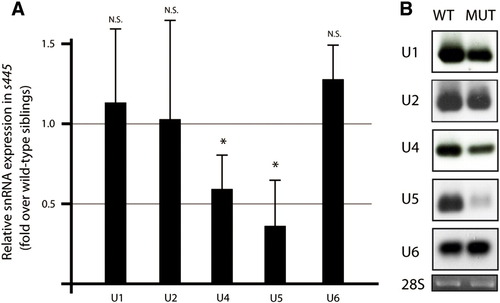
snRNA expression in s445 mutant larvae. (A) Real-time PCR to compare snRNA gene expression between wild-type and s445 mutant larvae at 100 hpf. Data are represented as fold change relative to expression levels in wild-type larvae. The expression levels of U1, U2, and U6 snRNAs are not significantly changed, while those of U4 (average 0.59 fold; s.d. = 0.22; p = 0.037) and U5 (average 0.36 fold; s.d. = 0.29; p = 0.024) snRNAs are down-regulated in s445 mutant larvae. *, p < 0.05; N.S., not significant (p > 0.05). (B) Northern blotting of snRNAs. Total RNA from wild-type and s445 mutant larvae at 100 hpf were blotted with snRNA probes to the indicated genes. A probe for the 28S ribosomal RNA was used as a loading control. |
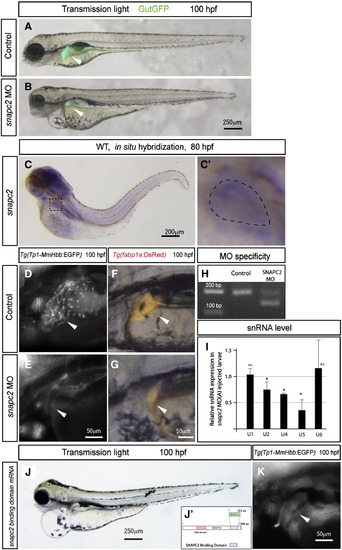
Zebrafish Snapc2 is essential for intrahepatic biliary network formation. (A and B) Bright-field images of wild-type (A) and snapc2 morpholino injected (B) larvae at 100 hpf are overlaid with Tg(gutGFP)s854 fluorescence (green). Snapc2 morpholino injected larvae show smaller livers and mild pericardial edema. (C) Snapc2 expression in wild-type larvae at 80 hpf. Snapc2 expression is detected in the liver at this stage. The outlined area is magnified and shown in E2. The liver is outlined in E2. (D and E) Tg(Tp1bglob:EGFP)um14 expression in the intrahepatic biliary network of wild-type (D) and snapc2 morpholino injected (E) larvae at 100 hpf. Tg(Tp1-MmHbb:EGFP)um14 expression is absent from the snapc2 morpholino injected liver. (F and G) Tg(fabp1a:DsRed)gz15 expression in the hepatocytes of wild-type (F) and snapc2 morpholino injected (G) larvae at 100 hpf. Lateral views, anterior to the left. White arrowheads point to the liver in each image. (H) Reverse transcriptase-PCR analysis shows that 52 bp are deleted from snapc2 mRNA in snapc2 MO(A) injected larvae. (I) Real-time PCR to compare snRNA gene expression between wild-type and snapc2 MO(A) injected larvae at 60 hpf. Data are represented as fold change relative to expression levels in wild-type larvae. The expression levels of U1 and U6 snRNAs are not significantly changed, while those of U2 (average 0.75 fold; s.d. = 0.153), U4 (average 0.657 fold; s.d. = 0.02) and U5 (average 0.368 fold; s.d. = 0.218) snRNAs are down-regulated in s445 mutant larvae. *, p < 0.05; N.S., not significant (p > 0.05). (J) Bright-field image of snapc2 binding domain mRNA injected larvae at 100 hpf. Schematic of the Snapc2 binding domain of Snapc4 is shown in (J2). (K) Tg(Tp1bglob:EGFP)um14 expression in the intrahepatic biliary network of snapc2 binding domain mRNA injected larvae at 100 hpf. EXPRESSION / LABELING:
PHENOTYPE:
|
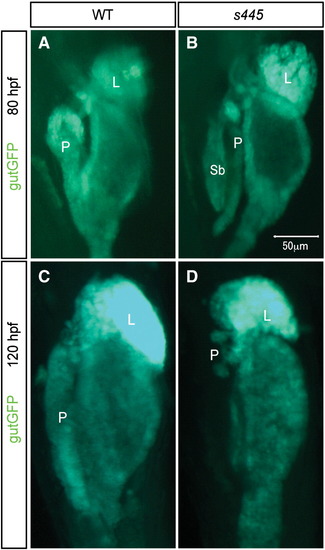
The morphologies of endodermal organs in s445 mutant larvae. Tg(gutGFP)s854 expression in wild-type (A and C) and s445 mutant (B and D) larvae at 80 (A and B) and 120 (C and D) hpf. Ventral views, anterior to the top. (A and B) At 80 hpf, the exocrine pancreas is thinner in s445 mutant larvae. (C and D) By 120 hpf, the exocrine pancreas has degenerated in s445 mutant larvae. L, liver; P, pancreas; Sb, swim bladder. EXPRESSION / LABELING:
PHENOTYPE:
|

The intrahepatic biliary network differentiates properly in s445 mutant larvae. Projected confocal images of the liver at 80 hpf. Wild-type (A) and s445 mutant (B) Tg(Tp1-MmHbb:EGFP)um14 larvae visualized for GFP expression. There is no difference in Tg(Tp1-MmHbb:EGFP)um14 expression at 80 hpf, suggesting that biliary epithelial cells differentiate properly in s445 mutant larvae. Ventral views, anterior to the top. EXPRESSION / LABELING:
|
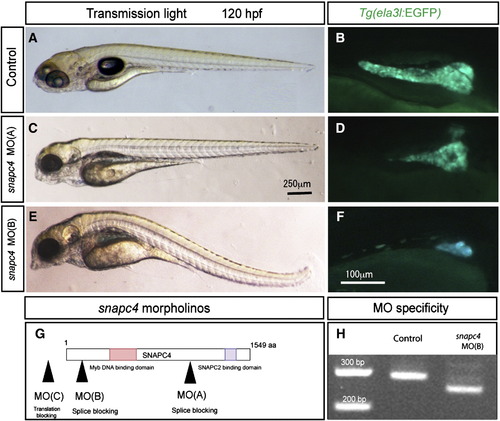
Phenocopy of the s445 mutant phenotype by morpholino antisense oligonucleotides. (A–F) Lateral views of wild-type control (A and B), snapc4 MO(A) injected (C and D), and snapc4 MO(B) injected (E and F) larvae at 120 hpf. Tg(ela3l:EGFP)gz15 expression is shown in B, D, and F. snapc4 MO(A) injected larvae show an identical phenotype to that of s445 mutant larvae. Lateral views, anterior to the left (A, C and E) or the right (B, D and F). (G) Schematic of snapc4 morpholino target locations. MO(A) is designed to target the splice junction prior to the Snapc2 binding domain. MO(B) is designed to target the splice junction prior to the Myb DNA binding domain. MO(C) is designed to target the translation initiation site. (H) Reverse transcriptase-PCR analysis shows that snapc4 mRNA was truncated in snapc4 MO(B) injected larvae. |
Reprinted from Developmental Biology, 363(1), Schaub, M., Nussbaum, J., Verkade, H., Ober, E.A., Stainier, D.Y., and Sakaguchi, T.F., Mutation of zebrafish Snapc4 is associated with loss of the intrahepatic biliary network, 128-137, Copyright (2012) with permission from Elsevier. Full text @ Dev. Biol.