- Title
-
Yeast-based assay identifies novel Shh/Gli target genes in vertebrate development
- Authors
- Milla, L.A., Cortes, C.R., Hodar, C.Q., Onate, M.G., Cambiazo, V., Burgess, S.M., and Palma, V.
- Source
- Full text @ BMC Genomics
|
neo1 expression is reduced in Shh/Gli pathway mutants and increased on Shh/Gli pharmacological activation. neo1 is expressed broadly in the developing CNS (A). Expression in 48 hpf embryo can be detected in the otic vesicle, in the notochord (B, close-up D, black bracket) and in the eye (E, black arrowhead), probably in the retinal ganglion cell layer (gcl). (C) Cartoon of a 48 hpf zebrafish eye. Blue line shows neo1 expression in the gcl. At 48 hpf neo1 expression is diminished in gli1 (dtr) and smu (smo) mutants, specifically in the notochord (F, H, bracket) and the gcl in the optic placode (G, I; black arrowhead) in comparison to WT (D, E). (J, K) neo1 mRNA is increased in notochord. Note that (J) and (K) controls were developed at different times in comparison to (D) in order to match to their corresponding pur treatment (K). Anterior is towards left, lateral views are showed except in (E, G, I, K) with dorsal views anterior up. Scale bars; 50 μm except in A (100 μm). WT; wild type. gcl; retinal-ganglion cell layer. DMSO is the vehicle for pur. |
|
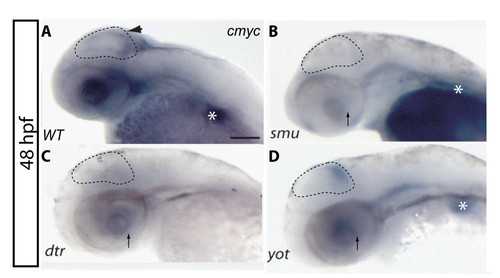
C-myc expression is lost in the CNS in Shh/Gli pathway mutants. A) c-myc is normally expressed in the optic tectum (black arrowhead) and the developing eye. Strong expression is also detected in the liver (white asterisk). B) smu mutant embryos show no expression of c-myc in the CNS. C) dtr embryos have no c-myc in the eye (black arrow), tectum and liver. D) yot embryos still show labelling for c-myc, although reduced; in both the eye and optic tectum labelling is preserved. Liver also retains some c-myc labelling. All lateral views are dorsal up, anterior left. |
|
sfrp2 RNA levels are disturbed in Hh pathway mutants and after pharmacological treatments. (A, A′ ′) In WT embryos, sfrp2 expression is evident in adaxial cells. This expression is significantly down-regulated in yot embryos (B, B′ ′). Pharmacological treatments with pur and cyc show altered expression in pharyngeal arches (asterisk in E, compare C, D and E for different levels of RNA). Anterior is towards left, lateral views are shown. Full lateral views of embryos are shown in A′ and B′. |
|
Analysis of in-vivo drug response based on ptc1 expression. Control of zebrafish long-term pharmacological Hedgehog gain and loss of function treatment. ptc1 readout-gene expression was verified by in situ hybridization. |


