
- Title
-
Robo2 determines subtype-specific axonal projections of trigeminal sensory neurons
- Authors
- Pan, Y.A., Choy, M., Prober, D.A., and Schier, A.F.
- Source
- Full text @ Development
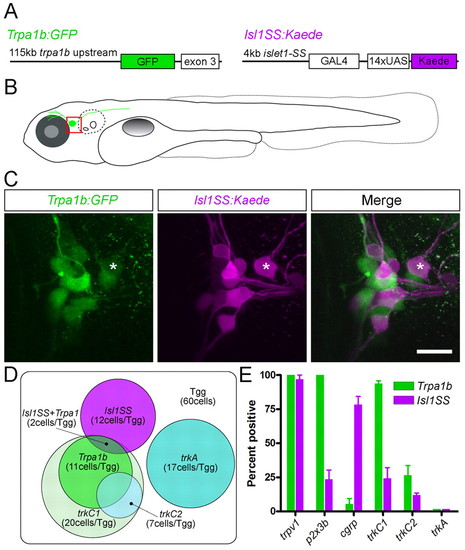
Trigeminal subtype reporter lines and marker gene expression. (A) Transgenic constructs used to generate Trpa1b:GFP (left) and Isl1SS:Kaede (right) transgenic lines. (B) Illustration of a trigeminal sensory neuron (green cell abutting the eye) in a fish at 5 dpf. The trigeminal ganglion (boxed area) is shown in C. (C) Trigeminal ganglion in a 5 dpf Trpa1b:GFP;Isl1SS:Kaede double-transgenic larva. GFP-positive (green) and Kaede-positive (magenta) trigeminal sensory neurons are largely distinct. Asterisk indicates a double-labeled cell. (D) Summary Venn diagram of distinct trigeminal subtypes defined by neurotrophin receptors (trkA and trkC1) and transgenic reporters. The box represents the entire trigeminal ganglion (Tgg) and circles indicate populations of trigeminal sensory neurons labeled by the markers indicated. (E) Quantification of marker gene expression (%) in each subset at 2 dpf. Error bars indicate s.e.m. Three to ten ganglia were counted for each marker. Scale bar: 20 μm. EXPRESSION / LABELING:
|
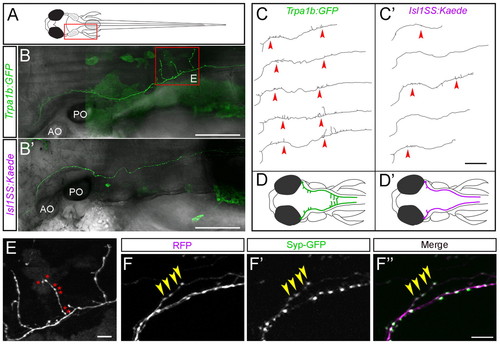
Mosaic single-cell labeling of trigeminal sensory neuron subtypes. (A) Schematic of a 5-dpf larval zebrafish, viewed from the dorsal side. The boxed area corresponds to the imaged areas shown in B,B′. (B,B′) In vivo imaging of single trigeminal sensory neurons. Fluorescent image is shown in green and bright-field image is superimposed in gray. Extensive branch growth is seen in the Trpa1b subset (B), but not the Isl1SS subset (B′). Boxed area corresponds to imaged area shown in E. (C,C′) Axon traces of multiple trigeminal sensory neurons are shown for both subtypes. Red arrowheads point to branches that form along the main axon tract. (D,D′) Illustrations of trigeminal afferents from Trpa1b (D) and Isl1SS (D′) subtypes. (E) High-magnification image of boxed area in B. Trpa1b axon extends branches and forms numerous varicosities (asterisks). (F-F′′) Trigeminal axon labeled with cytoplasmic RFP (magenta, F) and Synaptophysin-GFP (Syp-GFP, green, F′), a fluorescent label for synaptic vesicles (with merge in F′′). The presence of varicosities reliably predicts the presence of Syp-GFP puncta (yellow arrowheads). AO, anterior otolith; PO, posterior otolith. Scale bars: 100 μm in B-C′; 10 μm in E-F′′. |
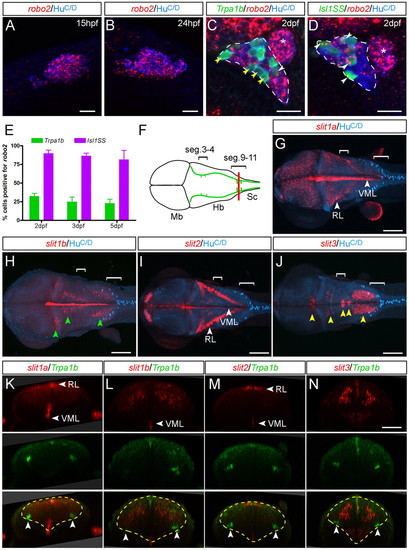
Expression of robo2 and Slit genes. (A,B) Trigeminal ganglion (cluster of blue cells, HuC/D positive) expresses robo2 (red speckles) in most cells at early stages. (C,D) Starting at 2 dpf, robo2 becomes differentially expressed in Tpra1b versus Isl1SS subtypes. The trigeminal ganglion is outlined (dashed lines); the anterior lateral line ganglion is located just posterior to it (asterisk) and is not labeled by either reporter line. (C) In the Trpa1b reporter line, most labeled trigeminal neurons (green cells) are negative for robo2 (yellow arrowheads), with a small proportion that are positive (white arrowhead). (D) In the Isl1SS reporter line, most labeled trigeminal neurons are positive for robo2 (white arrowheads). (E) Quantification of robo2 expression in the two subtypes at different developmental stages. robo2 expression is consistently higher in the Isl1SS subtype from 2-5 dpf. Error bars indicate s.e.m. (F) Diagram of a 3 dpf zebrafish brain viewed from the dorsal side, corresponding to images shown in G-J. Green lines show the trajectory of the trigeminal afferent track. Brackets indicate segments 3-4 and 9-11. (G-J) Whole-mount in situ hybridization for Slit genes co-stained for a neuronal marker (HuC/D). Images are maximal projections of confocal z-stacks. (G,I) slit1a and slit2 are strongly expressed in the ventral midline (VML) and rhombic lip (RL). (H) slit1b is expressed in the ventral midline as well as in several distinct nuclei in the hindbrain (green arrowheads). (J) slit3 is expressed in the cranial motor nuclei (yellow arrowheads). (K-N) Optical transverse sections at the hindbrain-spinal cord boundary (red line in F) of 3-dpf Trpa1b:GFP larvae stained for Slit genes (red) and Trpa1b:GFP (green). slit1a is also diffusely expressed in the caudal hindbrain (K). Yellow dashed lines mark the outlines of the hindbrain and arrowheads indicate trigeminal axons. Mb, midbrain; Hb, hindbrain; SC, spinal cord. Scale bars: 20 μm in A-D; 100 μm in G-J; 50 μm in K-N. EXPRESSION / LABELING:
|
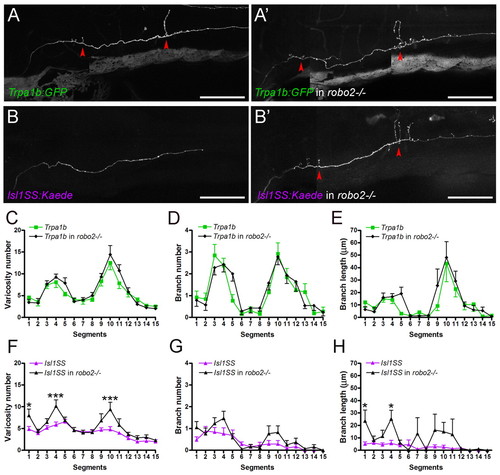
Robo2 regulates subtype-specific projection patterns. (A-B′) Trigeminal axonal morphology in wild-type and robo2-/- zebrafish. Red arrowheads point to branches. Trpa1b axonal morphology in robo2-/- is indistinguishable from that of wild type (A,A′). By contrast, there is a noticeable increase in branch length and varicosity number in the Isl1SS subtype in robo2-/- (B,B′). (C-E) Comparison of Trpa1b morphology in wild type (green) versus robo2-/- (black). No differences were seen in varicosity number (C), branch number (D) or branch length (E). (F-H) Comparison of Isl1SS morphology in wild type (magenta) versus robo2-/- (black). Significant differences were seen in varicosity number (F) and branch length (H), but not branch number (G). Error bars indicate s.e.m. *, P<0.05; ***, P<0.001. Scale bars: 100 μm. |
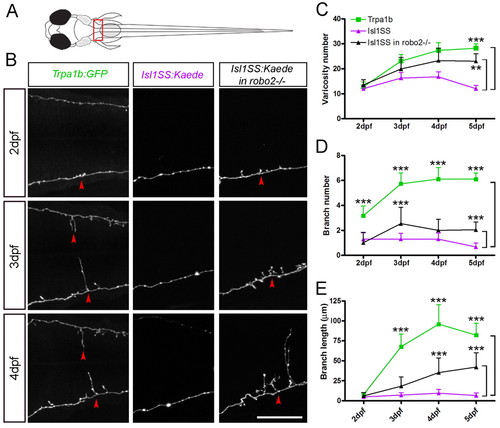
Morphogenesis of subtype-specific branch growth and synaptogenesis. (A) Multi-time point imaging was performed in segments 9-11 (boxed area), where the innervation pattern differs most between Trpa1b and Isl1SS neurons. (B) Fluorescent images of individual trigeminal sensory neuron afferents imaged from 2 to 4 dpf. Representative examples are shown for Trpa1b (left column), Isl1SS (middle) and Isl1SS in robo2-/- (right) zebrafish. Red arrowheads point to branches. (C-E) Afferent morphology is compared between genotypes (wild type versus robo2-/- in the Isl1SS subtype) and subtypes (Trpa1b versus Isl1SS). Error bars indicate s.e.m. **, P<0.01; ***, P<0.001. Scale bar: 50 μm. PHENOTYPE:
|
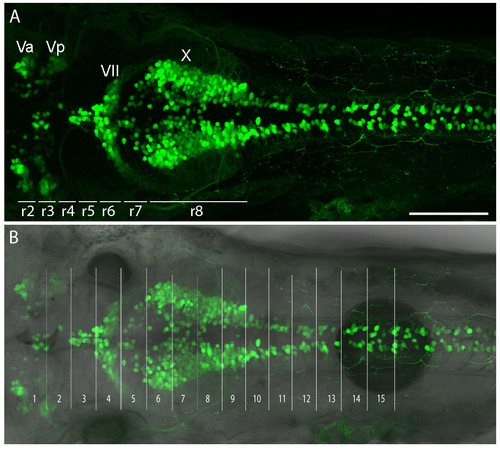
Correlation between physical landmarks and rhombomere positions. (A) A 5-dpf Islet1:GFP transgenic larva that labels cranial motor nuclei with GFP. This transgene is distinct from Isl1SS and uses a separate enhancer element of the islet1 gene. The positions of rhombomeres (r1-r8) are linked to the positions of various cranial motor nuclei. (B) Overlap of fluorescent image with bright-field image. Segments 1-15 are determined by bright-field physical landmarks. Va and Vp, anterior and posterior trigeminal motor nuclei; VII, facial motor nucleus; X, vagus motor nucleus. Scale bar: 100 μm. |
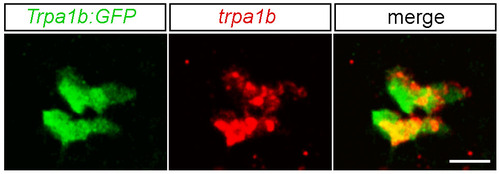
Trpa1b:GFP reporter line accurately marks trpa1b-expressing cells in trigeminal sensory neurons. trpa1b in situ hybridization was performed in 2 dpf Trpa1b:GFP transgenic fish. Images are single optical sections of trigeminal sensory ganglia, with GFP in green and trpa1b in red. All cells shown are positive for trpa1b. In total, seven ganglia were analyzed and 73 out of 74 fluorescent cells expressed trpa1b. Scale bar: 20 μm. EXPRESSION / LABELING:
|
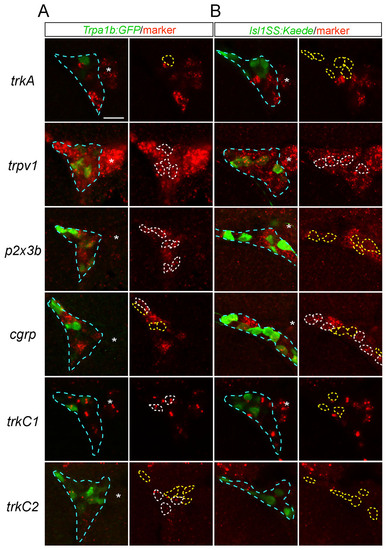
Expression of trigeminal sensory neuron markers in Trpa1b and Isl1SS subtypes. (A,B) Optical sections of 2-dpf trigeminal ganglion (outlined in blue) stained with RNA probes for sensory neuron markers (red) and antibodies against transgenic reporters (green, Trpa1b:GFP in A and Isl1SS:Kaede in B). Left panels show the merged image. Right panels show only marker staining, with transgenic reporter-positive cells outlined. White outlines indicate double-positive cells and yellow outlines mark GFP-only or Kaede-only cells. Percentages of marker-positive cells for each subtype are shown in Fig. 1E. trkC1 and trkC2 staining appears as two dots in the nucleus. Asterisk marks the adjacent lateral line ganglion. Scale bar: 20 μm. |