
- Title
-
Cerebroventricular Microinjection (CVMI) into Adult Zebrafish Brain Is an Efficient Misexpression Method for Forebrain Ventricular Cells
- Authors
- Kizil, C., and Brand, M.
- Source
- Full text @ PLoS One
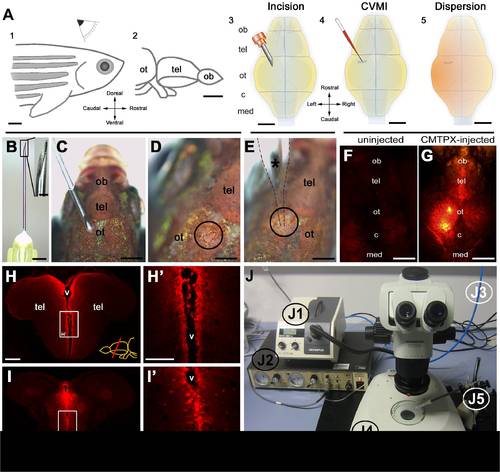
Overview of cerebroventricular microinjection (CVMI) paradigm and its target regions. (A) CVMI is performed at the dorsal surface of the head (1) and it targets, in this example, the forebrain that is rostral to the optic tectum (2). For injection, an incision is made into the skull over the optic tectum using a barbed-end canula (3). Through this slit, liquid is injected using a glass capillary (4). Injected liquid disperses rostrally (5). (B) The canula used for incision. (C) The incision on an adult fish. Dorsal view. (D) The incision site marked by dashed lines. (E) Injection with the glass capillary (*) (dotted lines mark the outline). (F) Dorsal view of an uninjected adult zebrafish head in red fluorescence channel. (G) Dorsal view of a CMTPX-injected adult zebrafish head in red fluorescence channel. (H) Cross section through the telencephalon. Ventricular cells are labelled with CMTPX. (H′) Higher magnification of the box in H. (I) Cross section through the midbrain. Ventricular cells are labelled with CMTPX. (I′) Higher magnification of the box in I. (J) Injection apparatus. J1: halogen light source with ring illuminator. J2: vacuum pump for microinjection. J3: pressurized air source. J4: dissecting microscope. J5: injection holder, needle and tubing. Scale bars: 500 μm A–G, 100 μm H-I′. ot: optic tectum, tel: telencephalon, ob: olfactory bulb, c: cerebellum, med: medulla, v: ventricle. |
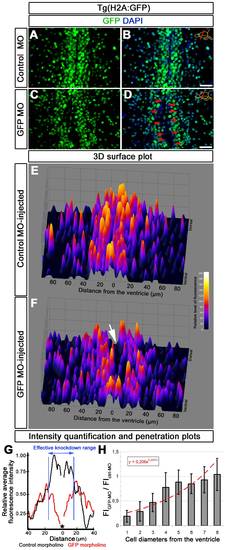
Analysis of morpholino penetration and efficient knockdown range. (A) GFP immunohistochemistry (IHC) on control morpholino-injected (Ctrl-MO) brain sections. (B) DAPI colocalization of A. (C) GFP immunohistochemistry (IHC) on GFP antisense morpholino-injected (GFP-MO) brain sections. (D) DAPI colocalization of C. Red arrows exemplify fully knocked-down cells. (E) 3D surface plot of A. x-axis: distance from the ventricle; y-axis: ventral to dorsal orientation; z-axis: relative level of fluorescence intensity. (F) 3D surface plot of C. x-axis: distance from the ventricle; y-axis: ventral to dorsal orientation; z-axis: relative level of fluorescence intensity. White arrow shows the gap, which indicates the knocked down cells. (G) Intensity quantification plot depicting relative fluorescence intensity versus distance from the ventricle in Ctrl-MO (black lines) and GFP-MO (red lines) injections. Black asterisk indicates the ventricle. Blue bars delineate the borders where GFP-MO injection leads to overt reduction in GFP fluorescence intensity. (H) Penetration prediction graph. The ratio of fluorescence intensity values between Ctrl-MO (FICtrl-MO) and GFP-MO (FIGFP-MO) versus cell diameters away from the ventricle is sketched. The trendline indicates the extent of knockdown in relation to cell diameters. Scale bars 20 μm. |
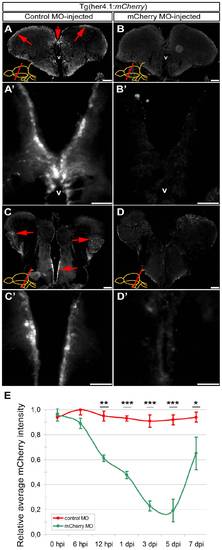
Morpholino-mediated gene knockdown using CVMI in Tg(her4.1:mCherry) reporter line. (A) Fluorescence reporter activity of Tg(her4.1:mCherry) transgenic line in the radial glial cells (red arrows along the ventricular surface) of the rostral telencephalon. (A′) Higher magnification of the dorsomedial region of A. (B) Fluorescence reporter activity in rostral telencephalon injected with translation-blocking vivo morpholinos for mCherry transgene. (B′) Higher magnification of the dorsomedial region of B, indicating the significant reduction of reporter activity. (C) Fluorescence reporter activity of Tg(her4.1:mCherry) transgenic line in the radial glial cells (red arrows along the ventricular surface) of the caudal telencephalon. (C′) Higher magnification of the medial region of C. (D) Fluorescence reporter activity in caudal telencephalon injected with translation-blocking vivo morpholinos for mCherry transgene. (D′) Higher magnification of the medial region of D, indicating the significant reduction of reporter activity. (E) Graph depicts the average mCherry fluorescence intensity in mCherry antisense morpholino-injected brains (green line) over a time course relative to control morpholino-injected brains (red line). Scale bars 50 μm. v: ventricle, tel: telencephalon, hpi: hours post injection, dpi: days post injection. N = 6 adult fish for each time point. |
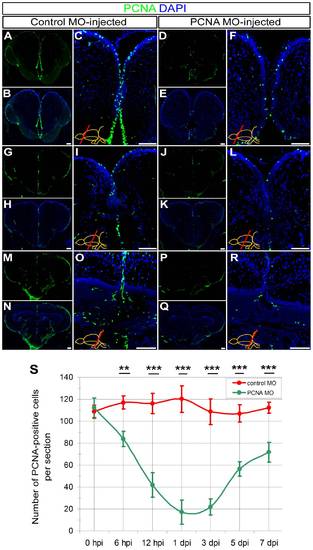
Knocking-down PCNA as an endogenous gene using CVMI. (A) PCNA immunohistochemistry (IHC) on rostral telencephalon of control morpholino-injected (ctrl-MO) brains. (B) DAPI counterstaining on A. (C) High magnification image of medial ventricular region of B. (D) PCNA IHC on rostral telencephalon of PCNA morpholino-injected (PCNA-MO) brains. (E) DAPI counterstaining on D. (F) High magnification image of medial ventricular region of E. (G) PCNA IHC on rostral telencephalon of ctrl-MO brains. (H) DAPI counterstaining on G. (I) High magnification image of medial ventricular region of H. (J) PCNA IHC on telencephalon of PCNA-MO brains on a more caudal level. (K) DAPI counterstaining on J. (L) High magnification image of medial ventricular region of K. (M) PCNA IHC on rostral optic tectum of ctrl-MO brains. (N) DAPI counterstaining on M. (O) High magnification image of dorsal region of N. (P) PCNA IHC on rostral optic tectum of PCNA-MO brains. (Q) DAPI counterstaining on P. (R) High magnification image of dorsal region of Q. (S) Graph depicts the average number of PCNA-positive cells in PCNA antisense morpholino-injected brains (green line) over a time course relative to control morpholino-injected brains (red line). Scale bars 50 μm. hpi: hours post injection, dpi: days post injection. N = 3 adult fish for each time point. |
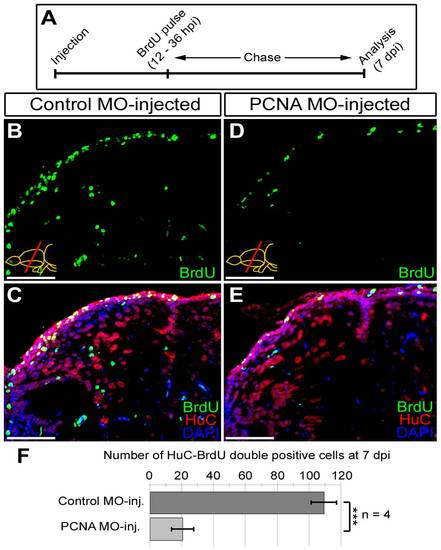
Knocking-down PCNA reduces neurogenesis as a functional consequence. (A) Schematic representation of the neurogenesis assay after PCNA knock-down. Following morpholino injection (control and PCNA-antisense), BrdU is given between 12 and 36 hours. Brains were analyzed at 7 days post injection (dpi) for BrdU (marker for proliferated cells), HuC (neuronal marker) and DAPI as a nuclear counterstain. (B) BrdU immunohistochemistry on the dorsal region of telencephalon from control morpholino-injected brain. (C) Co-staining for HuC and BrdU in control morpholino-injected dorsal telencephalon. (D) BrdU immunohistochemistry on the dorsal region of telencephalon from PCNA morpholino-injected brain. (E) Co-staining for HuC and BrdU in PCNA morpholino-injected dorsal telencephalon. (F) Graph depicts the average number of newborn neurons (HuC-BrdU double-positive cells) in control and PCNA morpholino-injected brains. Scale bars 50 μm. N = 4 adult fish. |
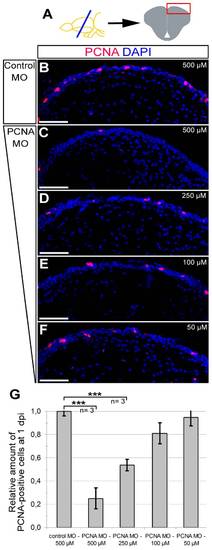
Morpholino-mediated gene knock-down using CVMI is dose-dependent. (A) The dose-response analyses were performed on dorsal regions of telencephalic sections. PCNA immunohistochemistry coupled to DAPI nuclear counterstaining on 500 μM control morpholino-injected (B), 500 μM PCNA morpholino-injected (C), 250 μM PCNA morpholino-injected (D), 100 μM PCNA morpholino-injected (E), 50 μM PCNA morpholino-injected (F) brains. (G) Graph depicts the relative amount of PCNA-positive cells in dorsal telencephalon after every dose in control and PCNA morpholino-injected brains. Scale bars 50 μm. N = 3 adult fish for every dose. |
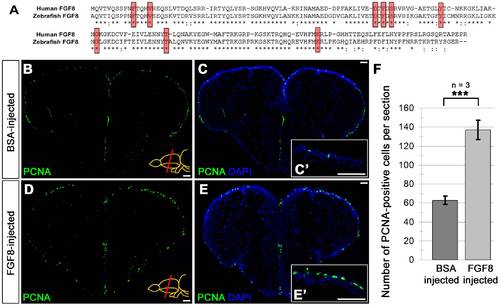
CVMI of FGF8 increases ventricular cell proliferation. (A) Pairwise sequence alignment between human FGF8 (NP_149355) and zebrafish Fgf8 (NP_571356) showing 86.4% similarity between two proteins. Red boxes indicate the residues required for ligand-receptor interaction and they are completely conserved between human and zebrafish. Asterisks indicate identical residues; semicolons indicate conservative substitutions. (B) PCNA immunohistochemistry (IHC) on the telencephalon of BSA-injected brains at 1 dpi. (C) DAPI counterstaining on A. (C′) High magnification of dorsal telencephalon. (D) PCNA immunohistochemistry (IHC) on the telencephalon of FGF8-injected brains at 1 dpi. (E) DAPI counterstaining on C. (E′) High magnification of dorsal telencephalon. (F) Graph depicts the average number of PCNA-positive cells per section. Scale bars 50 μm. N = 3 adult fish for each injection. |