
- Title
-
Apical migration of nuclei during G2 is a prerequisite for all nuclear motion in zebrafish neuroepithelia
- Authors
- Leung, L., Klopper, A.V., Grill, S.W., Harris, W.A., and Norden, C.
- Source
- Full text @ Development
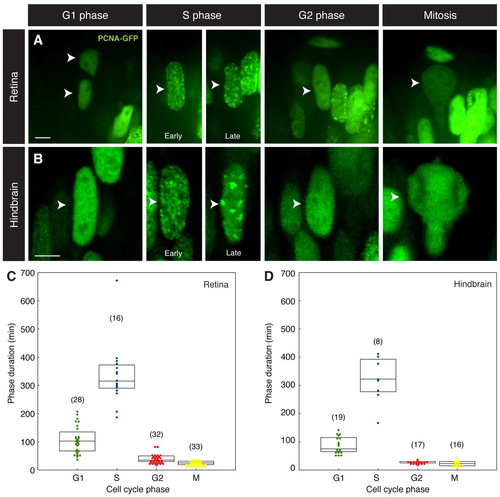
PCNA-GFP marks cell cycle phases. (A) Still images of zebrafish retinal nuclei followed through the cell cycle. Phases can be identified by the differential distribution of PCNA-GFP (arrowheads). (B) Similar cell cycle phase identification is possible for nuclei in hindbrain neuroepithelia (arrowheads). (C,D) Box plots illustrating distributed lengths of cell cycle phases for retinal (C) and hindbrain (D) nuclei. The top and bottom of each box indicate upper and lower quartiles, respectively; the horizontal line represents the median. The number of nuclei followed for each cell cycle phase is indicated in parentheses. Scale bars: 10 μm. |
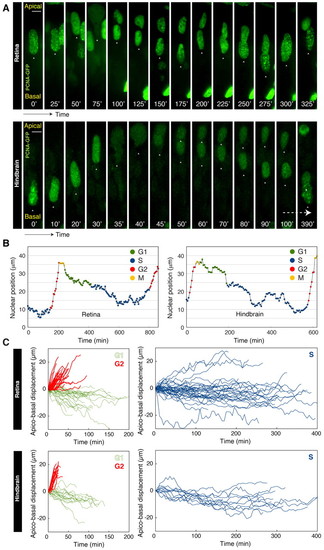
Modes of nuclear migration tied to specific cell cycle phases. (A) Time-lapse imaging of zebrafish retinal/hindbrain nuclei expressing PCNA-GFP. Nuclei show stochastic movements in S and G1 with rapid directed apical motion in G2 phase followed by mitosis. (B) Typical trajectory of a retinal/hindbrain nucleus over time. (C) Displacement of nuclei in G1, G2 or S phase measured relative to the initial position at the start of each phase for retinal or hindbrain nuclei. Scale bars: 5 μm. |
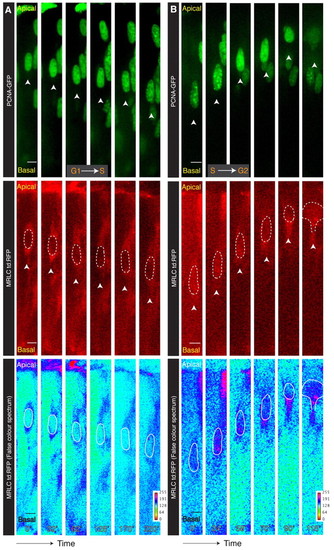
Temporal relationship of myosin localization with specific cell cycle phases. (A) Kymograph from supplementary material Movie 5 showing that Myosin regulatory light chain (MRLC) surrounds nuclei symmetrically in G1 and S phases. (B) Kymograph from supplementary material Movie 6 showing that MRLC accumulates basally after nuclei have entered G2 and separately for the cytokinetic furrow. The nucleus traced using the PCNA-GFP channel is outlined with broken line. Arrowheads in PCNA-GFP and MRLC:td:RFP channels are in equivalent positions, indicating the basal side of the nucleus over time. Scale bars: 5 μm. |
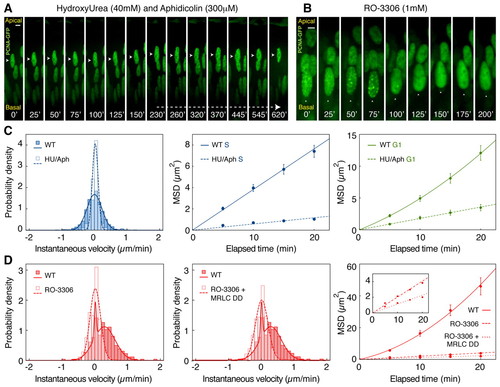
Cell cycle continuation is required for directed nuclear motion. Time-lapse imaging of nuclei blocked with pharmacological inhibitors of specific cell cycle phases. (A) Kymograph of retinal nucleus (arrowhead) in the presence of the S/G2 inhibitors HU and Aphidicolin, entering but remaining in S phase. (B) Kymograph of a retinal nucleus (arrowhead) in the presence of the G2/M inhibitor RO-3306, entering G2 but not migrating towards the apical surface. (C) Velocity distribution and MSD analysis confirm the absence of directed motion during S phase and a marked reduction in the effective displacement of treated nuclei. The MSD during G1 in treated zebrafish embryos increases linearly with elapsed time, in contrast to wild-type nuclei. (D) Velocity distribution and MSD analysis show the absence of directed motion in RO-3306-treated embryos. This effect cannot be rescued by co-expression of constitutively active Myosin regulatory light chain (MRLC-DD). Error bars indicate s.e.m. Scale bars: 5 μm. |
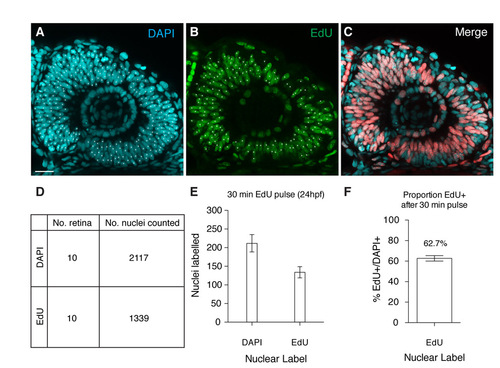
Short EdU labeling corroborates PCNA-GFP S-phase estimates. (A-C) Typical retina labeled with short pulse EdU (B) counterstained with DAPI (A). (D) The number of retina and nuclei counted. (E,F) The mean number of nuclei counted and the proportion of EdU-positive nuclei to total number. Error bars indicate s.e.m. Scale bar: 50 μm. |
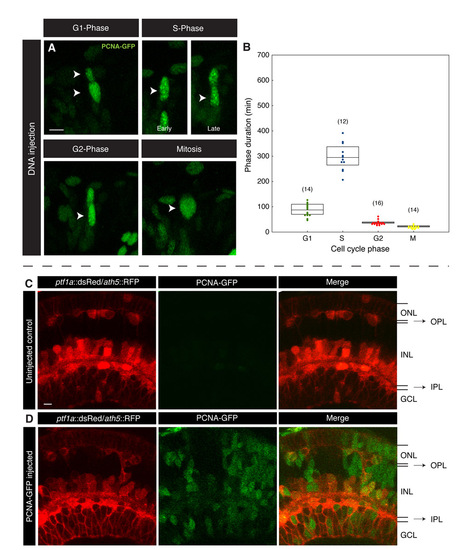
DNA injection of PCNA-GFP does not affect cell cycle length or phase proportions. (A) DNA injection of PCNA-GFP construct labels retinal nuclei mosaically and, as with RNA injection, all phases of the cell cycle are readily identifiable (arrowheads). (B) Cell cycle phase lengths are broadly similar to those seen with RNA injection. Error bars indicate s.d. and the number of nuclei measured are indicated in brackets. (C,D) Confocal slices through 56 hpf retinas transgenically expressing red fluorophores under the control of ptf1a (dsRed) and ath5 (RFP) promoters. The retinal lamination of an uninjected embryo (C) is compared with a PCNA-GFP-injected embryo (D) and no difference is seen. ONL, outer nuclear layer; OPL, outer plexiform layer; INL, inner nuclear layer; IPL, inner plexiform layer; GCL, ganglion cell layer. Scale bars: 10 μm. |
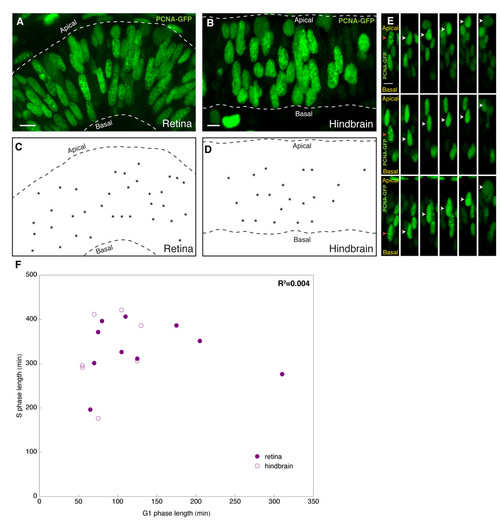
S phase is distributed throughout the apicobasal extent of retinal and hindbrain epithelia. (A-D) Typical optical slice through retina (A) or hindbrain (B) neuroepithelia at 24 hpf expressing PCNA-GFP through RNA injection. S-phase nuclei dominate in proportion in these tissues and can be seen throughout the apicobasal extent of these epithelia, as further depicted in schematics (C,D), in which S-phase nuclei of the corresponding image are marked (asterisks). (E) Kymographs showing directed apical motion of nuclei (white arrowhead) from S phase to M phase occurring irrespective of their apicobasal start position (red arrow). (F) S- and G-phase length comparison. Each circle represents the G1 (x-axis) and S (y-axis) phase length of a nucleus imaged in time-lapse. There was variability in the duration of both S and G1 between cells, but no correlation between the lengths of G1 and S. Scale bars: 10 μm. |