
- Title
-
Targeted mutation of the talpid3 gene in zebrafish reveals its conserved requirement for ciliogenesis and Hedgehog signalling across the vertebrates
- Authors
- Ben, J., Elworthy, S., Ng, A.S., van Eeden, F., and Ingham, P.W.
- Source
- Full text @ Development

Genomic location, expression, domain structure and subcellular localization of talpid3 and its encoded protein. (A) The chicken (Gallus gallus) ta3 locus is located in a region of chromosome 5 that shows conserved synteny with zebrafish (Danio rerio) chromosome 17, mouse (Mus musculus) chromosome 12 and human (Homo sapiens) chromosome 14 (based on UCSC genome browser). (B) Schematic representation of the chicken and zebrafish Talpid proteins showing the five coiled-coil domains in each (pink and green boxes, respectively) predicted using the program in http://groups.csail.mit.edu/cb/multicoil/cgi-bin/multicoil.cgi/cgi-bin/multicoil. Despite the low sequence identity (33%) between the two proteins, the number and distribution of coiled-coil domains are conserved. The location of the lesion associated with the chick ta3 mutant allele at residue 366 between the 1st and 2nd coiled-coil domains is indicated. (C,D) Distribution of ta3 mRNA revealed by in situ hybridization of early cleavage stage (C) or 2 dpf (D) embryos. Note the abundant maternally derived transcript in C. (E,F) GFP-tagged Talpid3 protein localizes to the basal body and the daughter centriole in cells of wild-type embryos (E). This localization is unaffected by mutation of igu, which encodes the basal body protein Dzip1 (F). |
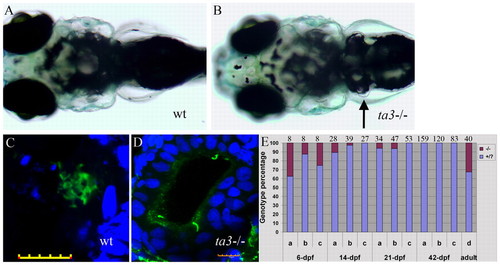
Zygotic loss of ta3 causes cystic kidney phenotype and larval lethality. (A,B) Wild-type (A) and ta3i265/ta3i262 trans-heterozygous mutant (B) larvae at 8 dpf showing the characteristic nephron ‘bubble’ (arrow in B). (C,D) Optical sections of pronephric tubules from wild-type (C) and ta3i265/ta3i262 mutant (D) larvae stained with anti-acetylated tubulin (green) to mark the axonemes of cilia and DAPI (blue) to mark nuclei; note the increased number of nuclei and the reduced number of cilia (green) in the dilated tubule lumen of the mutant compared with the narrow lumen and densely packed cilia in wild type. Scale bars: 10 μm. (E) Histogram showing percentage of animals transheterozygous for three different allelic combinations: (a) ta3i262× ta3i264; (b) ta3i268/ta3i266× ta3i263; (c) ta3i265× ta3i262 (represented by red shading) relative to heterozygous and homozygous wild-type siblings (represented by blue shading) 6, 14, 21 and 42 days post-fertilization (dpf). Most trans-heteroygotes fail to survive beyond 42 dpf. Animals homozygous for ta3i267 (d) are almost fully adult viable. The numbers above each column indicate the sample size. |
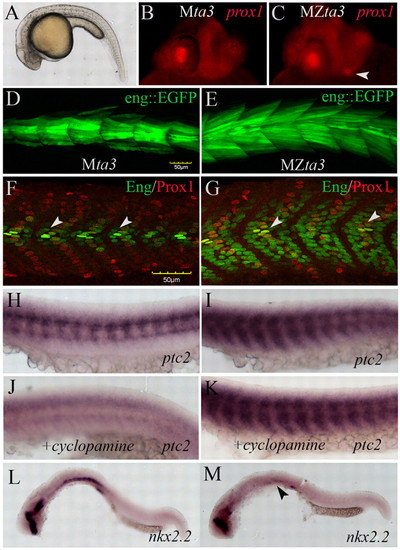
Disrupted Hh signalling in the somites and neural tube of Zebrafish MZta3 mutant embryos. (A-C) MZta3 mutant 24 hpf embryos display a characteristic curled body (A) and ectopic lens marked by the expression of Prox1 (arrowhead) (C). (D,E). Expanded domain of eng2a:GFP reporter gene expression in MZta3 (E) relative to control, zygotically rescued Mta3 heterozygotes (D). (F,G) Antibody staining of endogenous Eng and Prox1 proteins reveals that expansion of Eng is specific to the Prox1-negative fast-twitch muscle fibres; conversely, there is a reduction in the number of Eng expressing slow-twitch muscle pioneer fibres (arrowheads). (H,I) Expression of ptc2 in somites of Mta3 (H) and MZta3 (I) embryos showing expansion in latter. (J,K) Expression of ptc2 in somites of Mta3 (J) and MZta3 (K) embryos following incubation in cyclopamine. (L,M) Expression of nkx2.2 in the ventral neural tube (L) is lost in MZta3 mutants (M, arrowhead). |
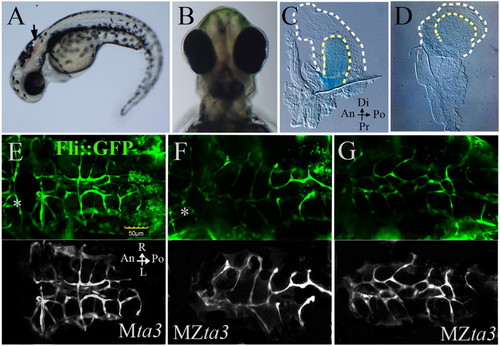
Fin and head abnormalities in MZta3 mutants. (A,B) MZta3 embryos at 2 dpf displaying hindbrain haemorrhage (arrow) and mild cyclopia (B). (C,D) Pectoral fins from Mta3 and MZta3 larvae stained with Alcian Blue, showing loss of asymmetry in mutant (D). Broken lines indicate the fin fold margin. (E-G) Cranial blood vessels marked by the fli::GFP transgene; background had been removed in lower monochrome panels for ease of observation. Note the mis-branched and merged vessels of the cerebellar central artery in the MZta3 embryos (F,G), beneath the haemorrhagic area. Posterior mesencephalic central artery is indicated by an asterisk. An, anterior; Po, posterior; Di, distal; Pr, proximal; L, left; R, right. |
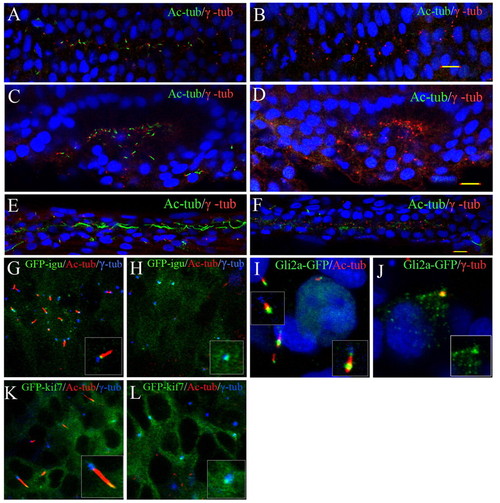
Disruption of primary ciliogenesis and aberrant localization of Hh signalling components in MZta3 embryos. (A-D) Confocal images of embryos fixed at the 10-somite (A,B) or 14-somite stage (C,D), and double stained with anti-acetylated tubulin (green) and anti-β tubulin (red) revealing the absence of cilia from the neural tube (B) and otic vesicle (D) of MZta3 mutants. (E,F) Similar preparations of embryos fixed at 24 hpf showing absence of long motile cilia from the pronephric duct of MZta3 mutants (F). (G-L) Localization of Hh pathway components in the primary cilia of somitic cells in 5- to 10-somite stage wild-type and MZta3 mutant embryos. Accumulation of a GFP-Dzip1 fusion protein in the basal body (G) is unaffected in MZta3 embryos (H). (I,K) GFP-tagged forms of Gli2a (I) and Kif7 (K) accumulate at the tip of primary cilia in wild-type cells; in the absence of the primary cilium in MZta3 embryos, both proteins shows a punctate localization in the basal body (J,L). EXPRESSION / LABELING:
PHENOTYPE:
|
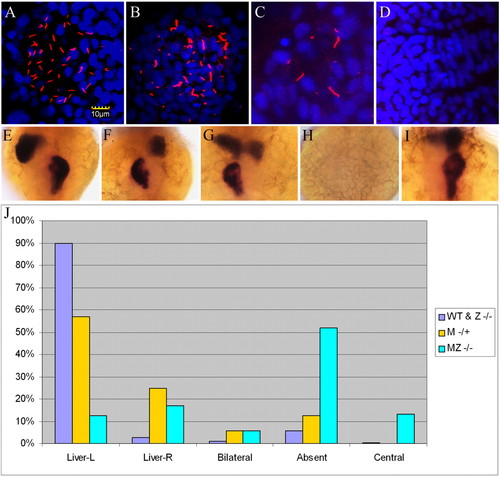
Disruption of left-right asymmetry in Mta3 and MZta3 mutants. (A-D) Confocal images of embryos stained with anti-acetylated tubulin (red) and DAPI (blue) showing Kupffer’s vesicle in wild-type (A) Mta3 (B,C) and MZta3 (D). Note the variable number and length of motile cilia in Mta3 embryos compared with wild type. (E-I) Examples of liver and exocrine pancreas orientation revealed by in situ hybridization for the liver marker l-fabp and the pancreas marker trypsin. Orientations are categorized into five phenotypes: left liver and right pancreas, typical of wild-type (E), right liver and left pancreas (F), bilateral (G), absent (H), and centralized liver and pancreas (I). (J) Frequency distribution of different phenotypes among wild-type and ta3/ta3 embryos, and Mta3 and MZta3 mutant embryos. EXPRESSION / LABELING:
PHENOTYPE:
|
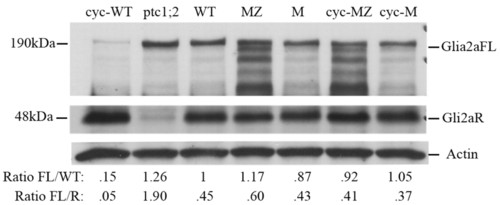
Processing of Gli2a is regulated by Hh activity and is disrupted in ta3 mutant embryos. Western blot of extracts of 28 hpf embryos probed with anti-Gli2a antibody. The full-length Gli2aFL form runs with apparent molecular weight of <190 kDa and the truncated Gli2aR form with an apparent molecular weight of <48 kDa. The same filter was probed with anti-actin, which serves as a loading control. Numbers below each lane show the level of Gli2aFL relative to that in wild-type normalized to control and the FL:R ratio for each sample based on densitometric analysis of filters exposed for identical times. Note, however, that the three panels shown here were exposed for different lengths of times for the purpose of clarity of presentation. Cyc, cyclopamine treated; M, Mta3 embryos; MZ, MZta3 embryos. |