
- Title
-
Betanodavirus induces oxidative stress-mediated cell death that prevented by anti-oxidants and zfcatalase in fish cells
- Authors
- Chang, C.W., Su, Y.C., Her, G.M., Ken, C.F., and Hong, J.R.
- Source
- Full text @ PLoS One
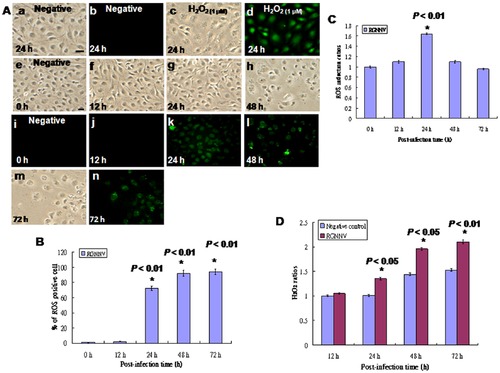
Identification of RGNNV infection induces ROS production in GF-1 cells. (A) ROS production (indicated by arrows) at 0, 12, 24, 48, and 72 h pi by cells infected with RGNNV (MOI = 1). The negative control (0 h) (see e and i); 24 h negative control (see a and b); RGNNV-infected groups at 12, 24, 48, and 72 h pi (see f–m and j–n, respectively; Green fluorescent cells as the ROS production positive cells); positive control H2O2 (1 µM) at 24 h post-incubation (see c and d; Green fluorescent cells as the ROS production positive cells). Scale bar = 10 μm. (B) The percentage of ROS-producing cells was counted at 0, 12, 24, 48, and 72 h, and shows a significant increase over time. In this and all subsequent figures (unless otherwise noted) data are presented as the percentage of 200 cells at each time point determined in triplicate, with each point representing the mean of three independent experiments. The vertical bars indicate ± the standard error of the mean (SEM). All data were analyzed using either a paired or unpaired Student′s t-test, as appropriate. Statistically significant was defined at P<0.01. (C) The ratios of ROS-producing cells were counted by fluorescence microplate reader at 0, 12, 24, 48, and 72 h, and showed a significant increase at 24 h pi, but not at 48 h and 72 h pi because those times left few cells in wells. *P<0.01 indicated a statistically significant difference between mean values of the groups. (D) Concentration of peroxide in medium of RGNNV-infected cells producing H2O2 ratio at 12, 24, 48, and 72 h pi, respectively. Peroxide concentration at each time point was determined in triplicate. *P<0.05. |
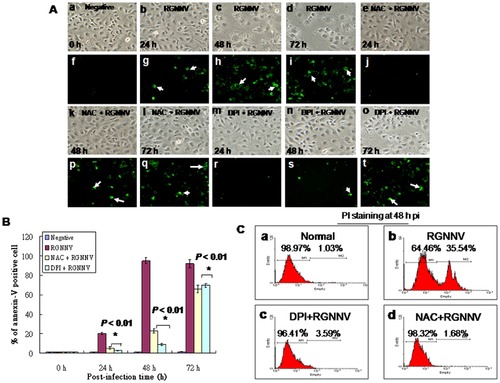
Identification of anti-oxidants treatment can reduce apoptotic/necrotic death of cells infected with RGNNV. (A) Phase-contrast and fluorescent micrographs of annexin-V–stained, RGNNV-infected GF-1 cells without drug-treatment at 0 h (a and f), 24 h (b and g), 48 h (c and h), and 72 h (d and i) or with NAC-treatment at 24 h (e and j), 48 h (k and p), and 72 h (l and q) and DPA-treatment at 24 h (m and r), 48 h (n and s), and 72 h (o and t). Annexin-V–positive cells (necrotic cells) are indicated by arrows. Scale bar = 20 μm. (B) The number of annexin-V–positive cells after infection with RGNNV at 0, 24, 48, and 72 h. Statistical comparisons were made using either a paired or unpaired Student′s t-test, as appropriate. *P<0.05. (C) Examples of flow cytometric profiles in 48 h pi. RGNNV-infected cell and plus anti-oxidants treatment cells PI staining fluorescence was measured from 10,000 cells. Numbers in second peak scales (PI+) show late apoptotic/secondary necrotic cell percentages respectively. Viable cell percentage (PI -) is shown in first peak. |
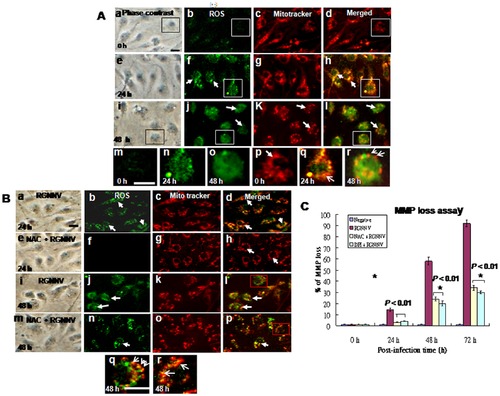
Identification of RGNNV-induced ROS production and the effect of ROS on mitochondrial morphology and loss of ΔΨ in GF-1 cells. Phase-contrast and fluorescence micrographs showing ROS production (the Image-iT LIVE Green Reactive Oxygen Species Detection Kit) and mitochondrial morphology (stained by Mito tracker) were in the same cells. (A) RGNNV-infected GF-1 cells at 0 h (a–d), 24 h (e–h; ROS produced in cells, and 48 h (i–l). The elongated mitochondrial network at 0 h in A:d is indicated by arrow in A:p. ROS production at 0 h in A:m is indicated in open square in A:b; at 24 h pi in A:n and p is indicated open square in A:f and h; at 48 h pi in A:o and r is indicated in open square in A:j and l. Breakdown of mitochondrial fission (indicated by arrows) at 48 h pi in A:r is indicated open square in A:l. Scale bar = 10 μm. (B) RGNNV-infected GF-1 cells treated with NAC at 24 h (e–h) and 48 h pi (m–p), or not treated at 24 h (a–d) and 48 h pi (i–l) with RGNNV infection. Blockade of mitochondrial breakdown in RGNNV-infected GF-1 cells at 48 h pi in B:p is indicated open square in B:l, which were appeared some dot of mitochondria and indicated by arrow; without RGNNV-infected cells at 48 h pi in B:r is indicated open square in B:p, which have shown more longer mitochondria in length that indicated by arrow. Scale bar = 10 µm. (C) The effect of anti-oxidants NAC and DPI on ΔΨ in cells infected with RGNNV. The ΔΨ (MMP loss) of RGNNV-infected GF-1 cells treated or not treated with NAC or DPI was determined at 0, 24, 48, and 72 h pi in triplicate. Statistical comparisons were made using either a paired or unpaired Student′s t-test, as appropriate. *P<0.05. |