
- Title
-
Dissecting the transcriptional regulatory properties of human chromosome 16 highly conserved non-coding regions
- Authors
- Royo, J.L., Hidalgo, C., Roncero, Y., Seda, M.A., Akalin, A., Lenhard, B., Casares, F., and Gómez-Skarmeta, J.L.
- Source
- Full text @ PLoS One
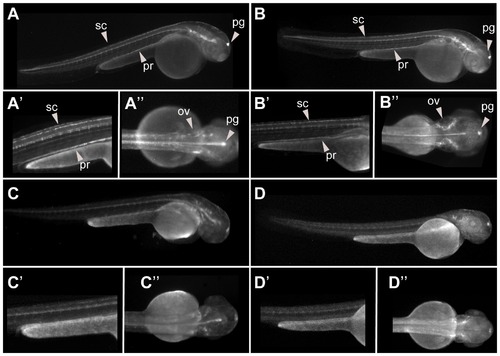
Reproducible enhancer. EGFP expression patterns exhibited from four different founders f(A–D) of the HCNR C32 at 48 hpf. EGFP expression can be seen in otic vesicle (ov), spinal cord (sc) and pronephros (pr). Fluorescence in the pineal gland (pg) in these and other embryos shown below correspond to non specific expression observed in most transgenic generated with the ZED vector. |
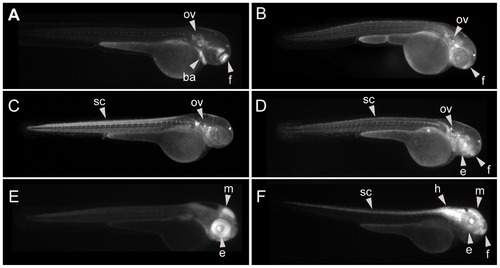
CNR with genomic boosting behaviour. EGFP expression patterns exhibited from six different founders (A–F) from HCNR C60 at 48 hpf. EGFP expression can detected in different territories depending on the founder, suggesting that a transcription pattern largely depending on the genomic context. Abbreviations are: branchial arches (ba), otic vesicle (ov), eye (e), forebrain (f), midbrain (m), hindbrain (h) and spinal cord (sc). |
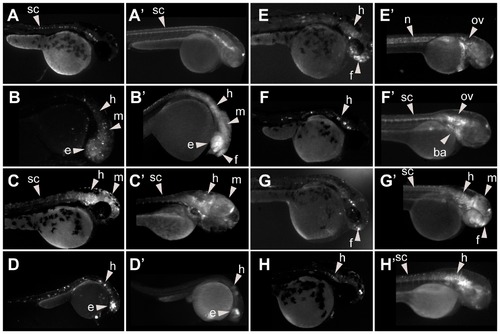
Reproducible enhancers may be distinguished in F0. Side by side comparison of the expression patterns expected from F0 (left panels) and the corresponding F1 (right panels). Strongly (A–D), but not weakly (E–H) reproducible enhancers showed a high similarity in transient (A–H) and stable (A2–H2) transgenic assays. Abbreviations are: notochord (n), branchial arches (ba), otic vesicle (ov), eye (e), forebrain (f), midbrain (m), hindbrain (h) and spinal cord (sc). |
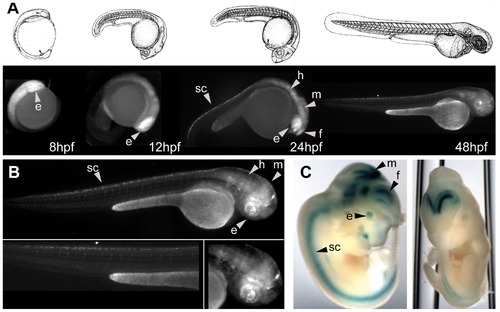
Enhancer assays in zebrafish allow a detailed spatiotemporal characterization of the expression patterns. A) Illustration of the first 48 hpf development of the zebrafish (upper panel). In the lower panel, EGFP expression of HCNR C81 during the first 48 hpf. B) Detailed EGFP expression of the HCNR C81 at 48 hpf. The same CNR was as assayed (Vista browser element37, http://pipeline.lbl.gov/cgi-bin/gateway2). Abbreviations are: eye (e), forebrain (f), midbrain (m), hindbrain (h) and spinal cord (sc). |
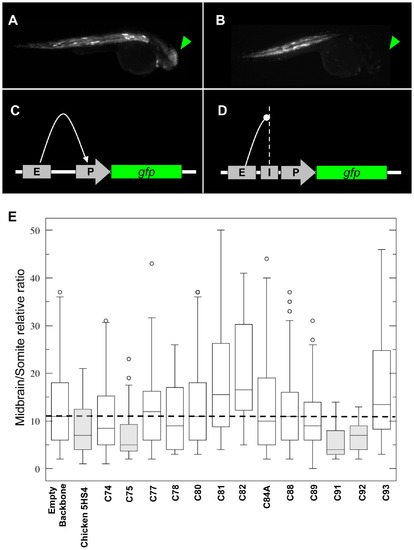
In vivo enhancer-blocking assay of HCNRs mapping the human IRXB locus. 30 hpf zebrafish injected with the insulator-vector assay lacking any HCNR (panel A) and C91 (panel B). With no insulator activity, Z48 enhancer interacts with the cardiac actin promoter promoting EGFP expression to the midbrain (C). Whenever an insulator is placed between the enhancer and the promoter, midbrain expression is reduced when compared to the somites expression, which remain unaffected. Adapted from Bessa et al, 2009. E) Wisker-plot representation of the midbrain/somite ratios from different regions tested. |
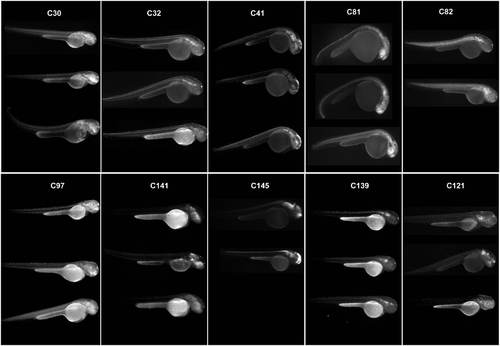
Expression patterns associated to HCNRs containing robust enhancers. Each box contains a series of pictures showing the expression pattern obtained from different founders from a single HCNR. Pictures were taken using a black/white camera with a GFP filter. |
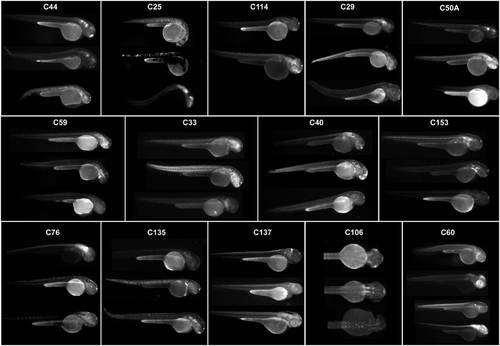
Expression patterns associated to HCNRs with variable enhancer activity. Each box contains a series of pictures showing the expression pattern obtained from different founders from a single HCNR. Pictures were taken using a black/white camera with a GFP filter. |
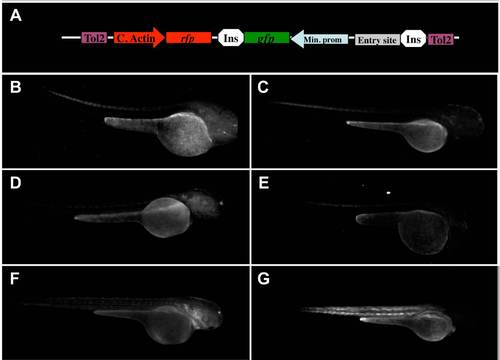
Controls suggest a low enhancer trapping capacity of the empty ZED vector. Diagram showing the structure of the ZED vector (A). Transgenic zebrafish evaluated at 48 hpf from six independent founders obtained from the ZED-zero construct. Pictures evidenced both spurious or no EGFP expression (B–F), despite strong RFP expression in the somites (G). Abbreviations: Tol2: Tol2 transposase target site; C. Actin: cardiac actin promoter; rfp; red fruorescent protein gene; ins: insulator; gfp: green fluorescent protein gene; Min. Prom: minimal promoter; entry site: gateway entry site, which was eliminated to generate the ZED-zero construct. |
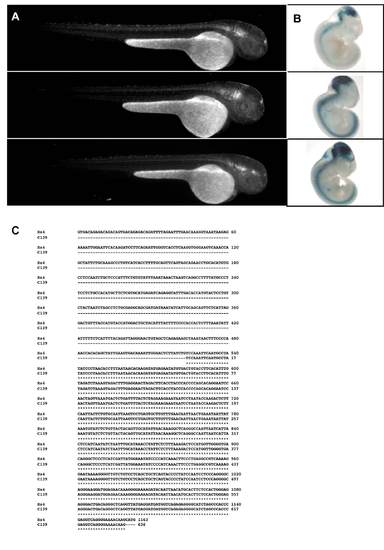
Comparison of the enhancer activity determined for C139 versus the data available from VISTA Element-4. Three different founders from zebrafish (A) and mice (B), obtained upon the evaluation of the enhancer activity of the human sequence assigned as C139 (A), or Element-4 (B). In panel C we represent the alignment of both sequences. |
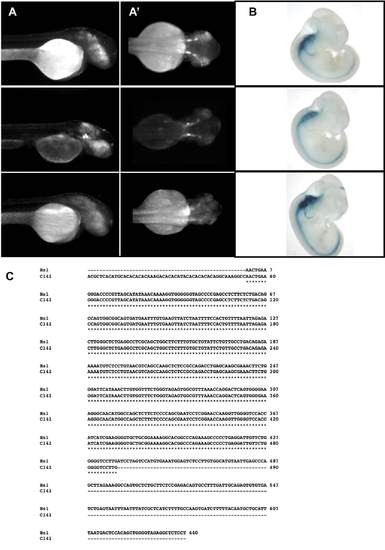
Comparison of the enhancer activity determined for C141 versus the data available from VISTA Element-1. Three different founders from zebrafish (A) and mice (B), obtained upon the evaluation of the enhancer activity of the human sequence assigned as C141 (A), or Element-1 (B). In panel C we represent the alignment of both sequences. |