
- Title
-
An iterative genetic and dynamical modelling approach identifies novel features of the gene regulatory network underlying melanocyte development
- Authors
- Greenhill, E.R., Rocco, A., Vibert, L., Nikaido, M., and Kelsh, R.N.
- Source
- Full text @ PLoS Genet.
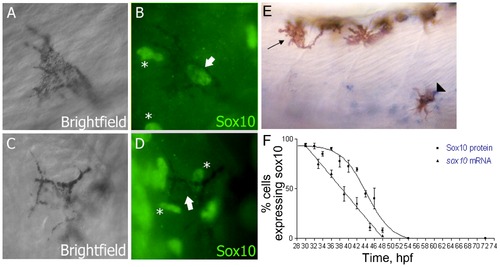
Sox10 is rapidly downregulated in differentiating melanocytes. A–D) Sox10 positive (A,B) and Sox10 negative (C,D) melanocytes from 33 hpf embryo are indicated by arrows. Non-pigmented cells expressing Sox10 are indicated (*). E) sox10 in situ hybridisation on 33 hpf embryo showing both sox10 positive (arrowhead) and sox10 negative (arrow) melanocytes. F) Time-course of percentage of melanocytes showing Sox10 or sox10 expression during melanocyte differentiation stages. Expression was examined in 20 pigmented cells from each of 5 fish (i.e. n = 100) at each time point. EXPRESSION / LABELING:
|
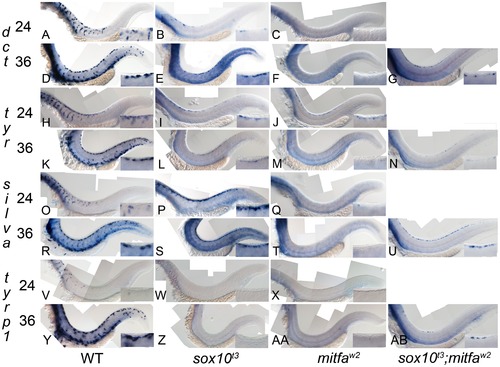
Residual melanocyte marker expression in sox10, mitfa, and sox10;mitfa mutants. A–AB) Expression of dct, tyr, silva and tyrp1b in wild-type (WT), sox10t3, mitfaw2 and sox10t3; mitfaw2 mutants is shown at 24 and 36 hpf as indicated. Insets in each panel show enlargement of area of dorsal posterior trunk. Note the pronounced derepression of silva and dct, mild derepression of tyr, and minimal residual expression of tyrp1. Note that all in situs were over-developed in order to detect low level expression. |
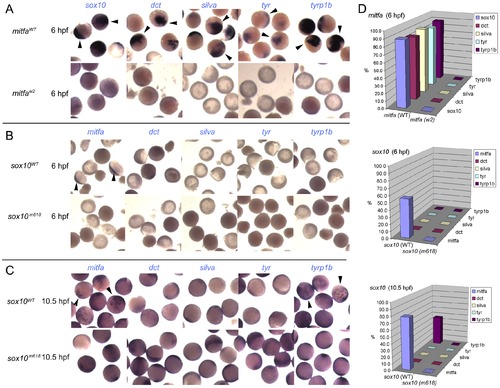
Induction of Mitfa-responsive genes is largely suppressed by Sox10. Representative groups of wild-type embryos are shown after injection of mRNA as indicated to left (mitfa (A) and sox10, assayed at 6 hpf (B) or 10.5 hpf (C)), raised to stage indicated, then fixed and processed by in situ hybridisation to detect genes named above panels (purple). Arrowheads indicate specific signal above background levels. D) Data is quantified as percentage of injected embryos showing expression in graphs at right (n>44 in each case). |
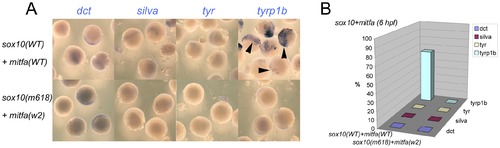
Co-expression of Sox10 and Mitfa represses most Mitfa-dependent expression of melanocyte differentiation genes. A) Representative groups of wild-type embryos injected with sox10 and mitfa mRNA were fixed at 6 hpf and processed for whole-mount in situ hybridisation to detect transcripts of genes indicated. B) Data is quantified as percentage of injected embryos (n>52 in each case). |
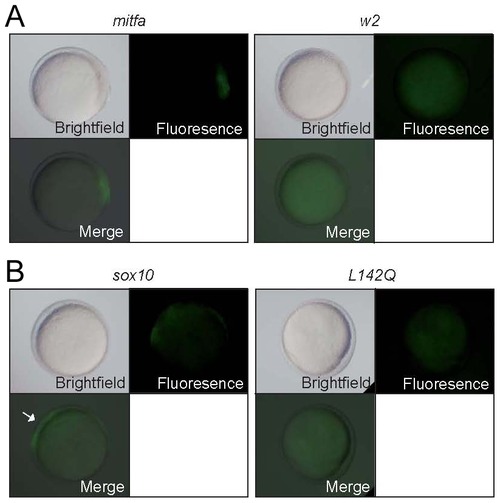
Mitfa-dependent activation of sox10 expression. Tg(-7.2sox10:GFP) embryos were injected with RNA encoding wild-type or w2 mutant mitfa (A) or wild-type or L142Q mutant sox10 (B). Representative embryos are shown at 10.5 hpf, with GFP expression detectable in those injected with wild-type, but not mutant forms. For quantitation, see Table 2. |
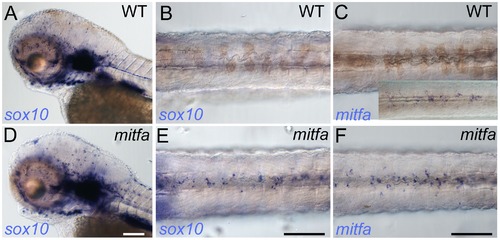
Mitfa-dependent repression of sox10 expression in neural crest. Whole-mount in situ hybridisation shows prominent expression of sox10 in peripheral glia and ear in mutants (D) and WT siblings (A); expression in WT melanocytes is undetectable (B), but mitfa mutants show prominent expression in many cells in the position of the dorsal stripe (E). (C, F) At this same stage expression of mitfa in WT siblings is undetectable under conditions used in this experiment (C), but can be shown by enhancing sensitivity by increasing PTU inhibition of melanisation and extending the signal development time (C, inset). Mitfa expression is clearly enhanced in mitfa mutants (F). Note that WTs have been treated with 0.00075% PTU to limit melanisation. B,C,E,F) dorsal views of posterior trunk, focused just above spinal cord. Scale bars, 100 μm. EXPRESSION / LABELING:
|
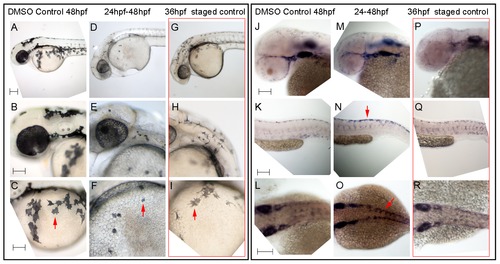
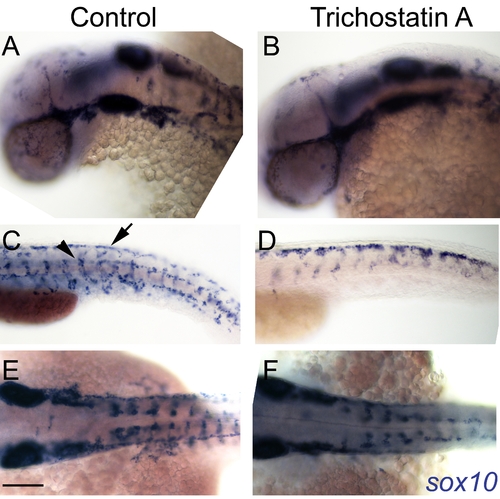
Hdac inhibition with Trichostatin A decreases melanocyte differentiation and prolongs sox10 expression in neural crest cells. A–I) Live embryos, showing close-ups of head (B,E,H) or yolk sac (C,F,I). (A–C) DMSO control embryo, (D–F) embryos treated with 1 μM Trichostatin A from 24–48 hpf (D–F). Note that whilst all are at 48 hpf nominal age, the Hdac inhibited embryos show morphological retardation, closely resembling 36 hpf untreated fish (G–I). Note that control 36 hpf untreated embryos (G–I) show significantly more melanisation than Hdac inhibitor-treated fish, indicating Hdac inhibition has specific effect on melanisation beyond simply general retardation. J–R) In situ hybridisation with sox10 probe showing elevated sox10 expression in premigratory (arrow, N) and migrating neural crest cells of Hdac inhibitor-treated fish (M–O) compared with DMSO controls (J–L). Note that sox10 expression is elevated even when compared with morphologically-matched 36 hpf embryos (P–R), and is thus not simply an effect of general retardation. Scale bar: 100 μm. |
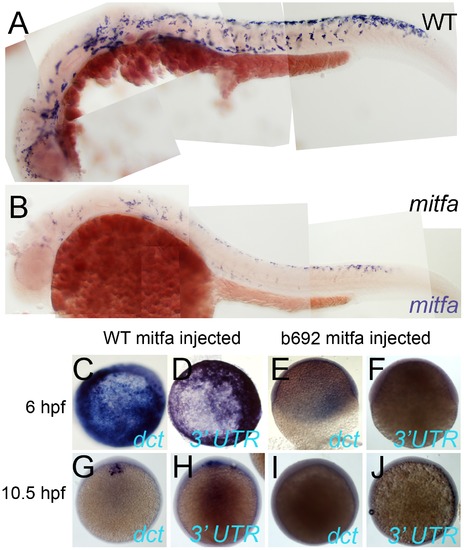
Mitfa-dependent maintenance of mitfa expression. A,B) Expression of Mitfa is reduced in mitfab692 mutant. A, B) Embryos from incross of mitfa heterozygotes were treated with PTU and processed for in situ hybridization with mitfa probes at 30 hpf stage. A majority (53/69; 73%) showed normal strong mitfa expression and were presumed wild-type siblings (A, WT), whereas 33/124 (27%) had weakened expression and were presumed mitfa mutants (B). C–J) Injection of RNA encoding WT Mitfa drives ectopic expression of dct (C,G) and mitfa (D,H) at both 6 hpf (C,D) and 10.5 hpf (G,H), whereas RNA encoding the Mitfa(b692) mutant form does not (E,F,I,J). Expression of the endogenous mitfa gene is detected using an anti-sense probe corresponding to the 32 UTR of the gene, a sequence absent from the injected RNA. Scale bar:100 μm. EXPRESSION / LABELING:
|
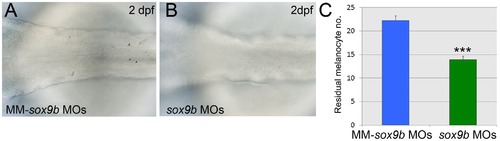
Sox9b is a component of the melanocyte GRN and shows properties consistent with Factor Z. Expression of residual melanin is compared in sox10 mutant embryos treated with sox9b morpholinos (B, sox9bMOs) or with control 5 bp mismatch morpholinos (A, MM-sox9b MOs). C) Quantitation confirms that weak residual melanin is significantly reduced by Sox9b knockdown compared to treatment with mismatch morpholinos. Graph shows mean±s.e.m., n = 154 (MM-sox9b MOs), 159 (sox9bMOs). ***, p<0.0001. |
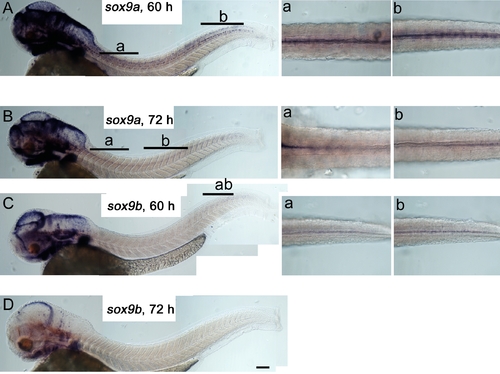
Neither sox9a nor sox9b are expressed in differentiated melanocytes. Lateral views of whole embryos (left) and dorsal views of dorsal stripe region (insets right, location indicated by lettered bars) show 60 hpf (A,C) and 72 hpf (B, D) embryos. In C, inset b shows a deeper focal plane than that in inset a. Embryos were treated with PTU to allow detection of even very weak signals. Scale bar 100 μm. EXPRESSION / LABELING:
|
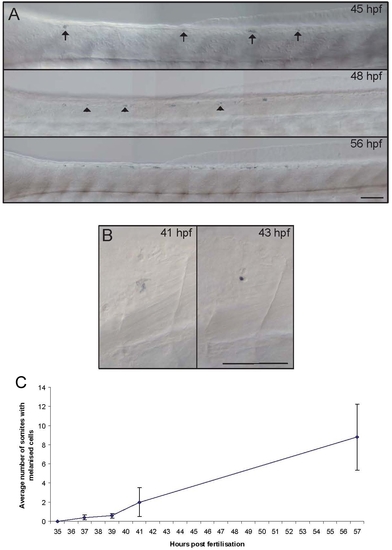
Residual melanised cells in sox10 mutants appear late and then increase with time. A) Photographs of dorsal trunk of a single embryo showing dynamic changes in residual melanised cells. Note how initially many cells show diffuse melanin (arrows) and how new melanised cells appear with time (arrowheads). B) Photographs of single melanised cell at consecutive time-points, showing change from diffuse melanin (41 hpf) to tiny, dense spot (43 hpf). C) Graphical plot of mean±s.e. number of segments containing residual melanised cells from a typical series of embryos (n = 19). |
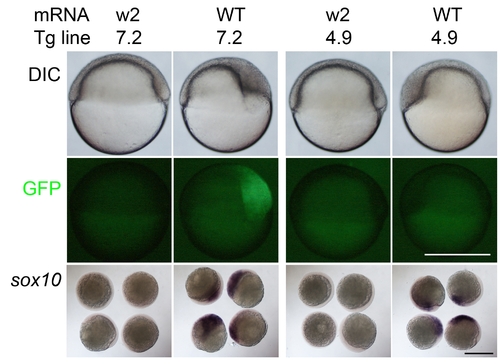
Mitfa-dependent regulation of sox10 transgenes narrows candidate regulatory elements. RNA encoding wild-type mitfa (WT) or the mutant form (w2) was injected into Tg(sox10(7.2):gfp) (7.2) and Tg(sox10(4.9):gfp) (4.9) embryos. Note that at 6 hpf, only the former, but not the latter, show GFP induction. As a control, sibling embryos injected with the same constructs were fixed and examined for induction of sox10; note that embryos injected with the wild-type mitfa showed robust induction of sox10 expression. Scale bar, 500 μm. For quantification, see Table S1. |
Hdac-dependent derepression of sox10 expression is not seen in mitfa mutant embryos. A–F) In situ hybridisation with sox10 probe showing similar levels of sox10 expression in premigratory (arrow, C) and migrating (arrowhead, C) neural crest cells of mitfa mutants whether treated with 1 μM Trichostatin A from 24–48 hpf (B,D,F) or in stage-matched 36 hpf DMSO control mitfa mutants (A,C,E). Compare effect in WT embryos shown in Figure 8. Scale bar: 100 μm. |