
- Title
-
A Src-Tks5 Pathway Is Required for Neural Crest Cell Migration during Embryonic Development
- Authors
- Murphy, D.A., Diaz, B., Bromann, P.A., Tsai, J.H., Kawakami, Y., Maurer, J., Stewart, R.A., Izpisúa-Belmonte, J.C., and Courtneidge, S.A.
- Source
- Full text @ PLoS One
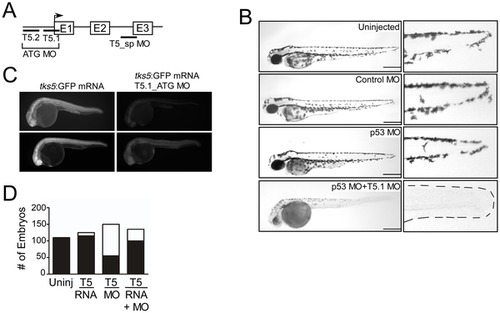
Tks5 is required for embryonic development in Danio rerio. (A) Schematic of Tks5 targeted morpholinos (MO) and the zebrafish Tks5 gene. (B) The morphology of Tks5 morphants (T5.1 MO+p53 MO) at 48 hpf compared to controls (Uninjected, Control MO, p53 MO). Enlarged images of the tail region show a reduction in posterior pigment cells (dashes outline tail in morphants). Scale bar represents 200 μm. (C) Tks5 MO specificity was determined by injecting embryos with either tks5:GFP mRNA or tks5:GFP mRNA together with Tks5 MO, and analyzing GFP expression. Two representative embryos from each injection are shown. (D) Quantification of murine Tks5 rescue of Tks5 morphant phenotypes. Embryos were injected as indicated in Experimental Procedures. The total number of morphants (white bars) was compared to the total number of normal embryos (black bars), and quantified as described in Materials and Methods (n = 3). PHENOTYPE:
|
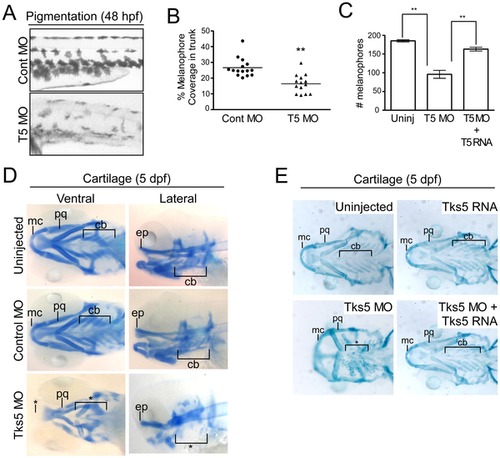
Decreased Tks5 expression results in neural crest-derived defects. (A–B) Melanophores within the trunk region above the yolk sac extension in control MO-injected and Tks5 MO-injected embryos were qualitatively (A) and quantitatively (B) analyzed. n = 15 embryos and SEM is shown by bar. p values obtained from Student′s t-test. ** denotes p<0.01. (C) Melanophores present in the dorsal, ventral, and lateral pigment lines were quantified to determine degree of murine Tks5 rescue of the decreased pigmentation seen in morphants. Mean values (n = 3) and SEM are shown in graph. p values obtained from Student′s t-test. ** denotes p<0.01. (D) Alcian blue staining was performed on indicated embryos to identify craniofacial structures (Meckel′s cartilage (mc), palatoquadrate (pq), ceratobranchials (ch), ethmoid plate (ep)). (*) denotes missing structures. (E) Alcian blue staining was performed on indicated embryos to determine if murine Tks5 could rescue craniofacial defects seen in morphants. Structures were identified as in (D). (*) denotes missing structures. |
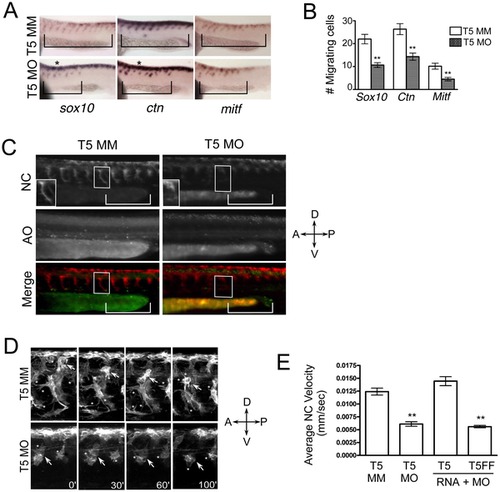
Neural crest migration in vivo requires Tks5. (A–B) Whole mount in situ hybridizations to detect neural crest cells were performed on control (Tks5 MM) and Tks5 morphant (Tks5 MO) embryos at 26 hpf. (A) Neural crest specific riboprobes against foxd3, sox10, and crestin (ctn) were used. Bars indicate anterior-posterior area of migrating cells. (*) indicates an increase in pre-migratory cells compared to controls (B) The number of cells migrating into the trunk region was quantified as described in Materials and Methods. Mean values (n = 18) and SEM were shown in graph. p values obtained from Student′s t-test. ** denotes p<0.01. (C) Control (T5 MM) and Tks5 morphant (T5 MO) Tg(sox10:RFP) embryos (28 hpf) were incubated with acridine orange as a marker for apoptosis and imaged by fluorescence microscopy. NC = neural crest cells, AO = acridine orange, brackets designate similar regions of migrating NC cells, and boxes label similarly positioned individual NC cells in the control and morphant embryos (enlarged in bottom left corner of top panel). (D) Control (T5 MM) and Tks5 morphant (T5 MO) Tg(sox10:RFP) embryos (30 hpf) were analyzed for neural crest migration by confocal time-lapse microscopy for 1.5 hours as described in Materials and Methods. Arrows follow ventral cell migration of an individual cell over the duration. * = protrusions emanating from neural crest cells (D = dorsal, V = ventral, A = anterior, P = posterior). (E) The average velocities of individual neural crest (NC) cells for control (T5 MM)-, Tks5 MO-injected, Tks5myc RNA and Tks5 MO co-injected, or Tks5FFmyc RNA and Tks5 MO co-injected Tg(sox10:RFP) embryos were quantified as detailed in Materials and Methods. Mean values (n = 10) and SEM are shown. p values obtained from Student′s t-test.** denotes p<0.01. |
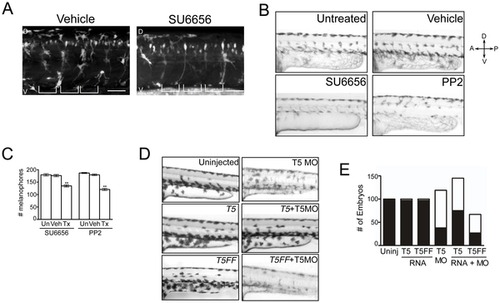
Neural crest derivatives require a Src-Tks5-dependent pathway in vivo. (A) Tg(sox10:RFP) embryos (8 hpf) were treated with either vehicle (DMSO) or SU6656 for 24 hours and imaged by confocal microscopy to detect neural crest cells. (D = dorsal, V = ventral). Brackets indicate the position of the somites. Scale bar represents 50 μm. (B–C) Embryos at 15 hpf were treated as indicated for 24 hours and analyzed for pigmentation defects. (B) Embryos where treatment was initiated at 15 hpf were examined for melanophore patterning in the trunk region above the yolk sac extension. (D = dorsal, V = ventral, A = anterior, P = posterior) (C) The total number of melanophores present in the dorsal and ventral pigment lines was counted for embryos within each group as described in Materials and Methods. Mean values (n = 3) and SEM were shown in graph. ** denotes p<0.01 for vehicle treated vs. SFK treated comparison. (D–E) Embryos were injected as indicated and qualitatively analyzed for defects described previously. Morpholino and RNA concentrations detailed in Materials and Methods. (E) Morphants were identified as described in Figure 1D and embryos within each group were quantified (white = morphants, black = normal). |
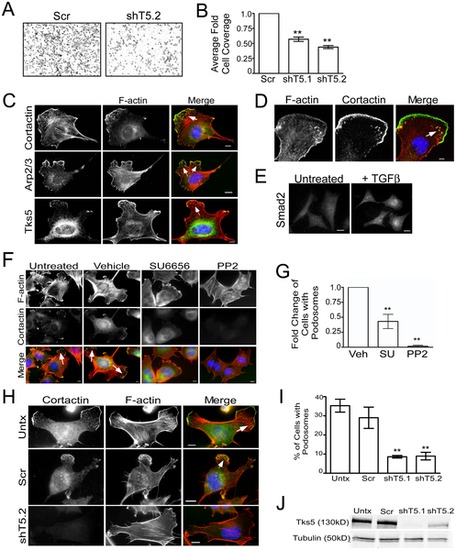
Migration of, and podosome formation in, neural crest stem cells requires Tks5. (A–B) Control (Scr) and Tks5 knockdown (shT5.1 and shT5.2) JOMA1.3 cells were exposed to a TGFβ gradient using the transwell migration assay. The number of migrating cells was qualitatively analyzed in each group (A) and quantified as described in Materials and Methods (B). Mean values (n = 3) and SEM were shown in graph. ** denotes p<0.01. (C) TGFβ-stimulated (25 ng/ml) JOMA1.3 cells were immunostained for F-actin (using phalloidin) and the podosome markers cortactin, Arp2/3, and Tks5 to identify formation of podosomes (arrows). In all cases, scale bars represent 10 μm and white arrows point to clusters of podosomes. (D) Confocal microscopy of TGFβ-stimulated JOMA1.3 cells co-stained for F-actin (using phalloidin) and cortactin. (E) JOMA 1.3 cells were treated with TGF-β and stained for SMAD2 by immunofluorescence to confirm activation of TGF-β-dependent pathways. (F–G) Vehicle (DMSO) or SFK inhibitors (SU6656 and PP2) were added to JOMA1.3 cells prior to TGF-β stimulation followed by analysis of podosome formation by immunostaining for F-actin (phalloidin) and cortactin (arrows). (G) The total number of cells with podosomes was quantified for each treatment group and analyzed as fold change of cells with podosomes compared to untreated cells. Fold change of cells was compared to vehicle treated cells. Mean values (n = 3) and SEM were shown in graph. ** denotes p<0.01 for vehicle vs. SFK treated comparison. (H–J) Tks5 was knocked-down in JOMA1.3 cells by two independent shRNA constructs [shTks5.1 (shT5.1), shTks5.2 (shT5.2)]. (H) Untreated, control (scrambled shRNA), and Tks5 knockdown cells were stimulated with TGFβ for 5 hours and stained for F-actin and cortactin to identify podosomes. (I) The percentage of cells with podosomes was quantified (as described in Materials and Methods. Mean values (n = 3) and SEM are shown. p values obtained from Student′s t-test. ** denotes p<0.01. (J) Tks5 knockdown was confirmed by immunoblot analysis for Tks5 using whole cell lysates and anti-Tks5 antibody. Protein levels were normalized to tubulin. |
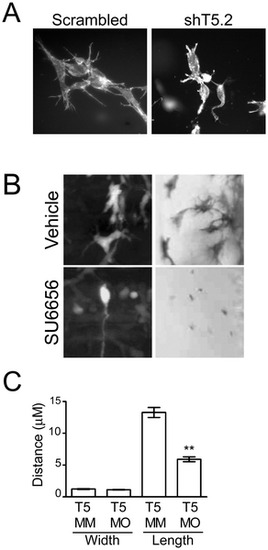
Src- and Tks5-dependent neural crest cell dendritic-like protrusions in 3-D culture and in vivo. (A) Control (scrambled) and Tks5 knocked-down (shT5.2) JOMA1.3 cells were placed in a three-dimensional collagen matrix and cultured for six days. Cells embedded in the collagen matrix were stained for F-actin (phalloidin) and analyzed for differences in cell structure (40×). (B) Neural crest cell and neural crest-derived cell protrusions were qualitatively examined by either enlarging images of neural crest cells in Tg(sox10:RFP) embryos obtained in 4A (left panels) or imaging melanophores in vehicle or SU6656 treated embryos at a higher magnification (23×) (right panels). (C) Control (Tks5 MM injected) and Tks5 morphant Tg(foxd3:GFP) embryos (30 hpf) were fixed and imaged by confocal microscopy. The width and length of protrusions was measured by Volocity software. Mean values (n = 20) and SEM are shown. p values obtained from Student′s t-test. ** denotes p<0.01. (D = dorsal, V = ventral, A = anterior, P = posterior). |
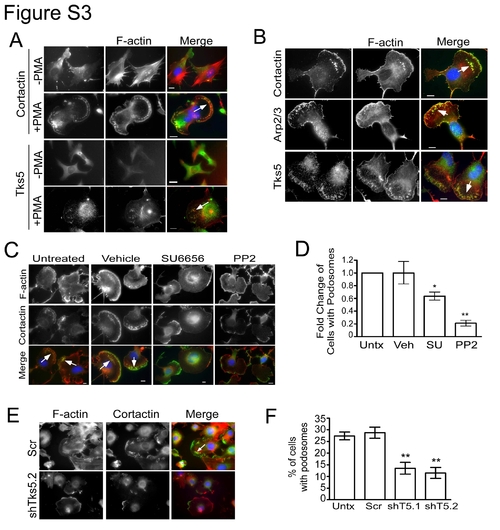
Neural crest stem cells form podosomes. (A) JOMA1.3 cells were stained for F-actin (phalloidin) and either cortactin or Tks5 in the presence and absence of PMA (25 ng/ml) to identify formation of podosomes (arrow). (B) PMA-stimulated (25 ng/ml) JOMA1.3 cells were immunostained for F-actin (using phalloidin) and the podosome markers cortactin, Arp2/3, and Tks5. (C–D) Vehicle (DMSO) or SFK inhibitors (SU6656 and PP2) were added to JOMA1.3 cells prior to PMA stimulation. (C) Analysis of podosome formation was conducted by immunostaining for F-actin (phalloidin) and cortactin (arrows). (D) The total number of cells with podosomes was quantified for each treatment group and analyzed as fold change of cells with podosomes compared to untreated cells. Mean values (n = 3) and SEM were shown in graph. p values obtained from Student′s t-test. * denotes p<0.05 for untreated vs. SFK treated comparison; ** denotes p<0.01 for untreated vs. SFK treated comparison. (E–F) PMA-treated control (uninfected and scrambled shRNA) and Tks5 knockdown (shT5.1, and shT5.2) cells were stained for F-actin (phalloidin) and cortactin to identify formation of podosomes. (F) Percentage of cells possessing podosomes was calculated as previously described. Mean values (n = 3) and SEM are shown in graph. ** denotes p<0.01 for scrambled versus shT5.1 and shT5.2. p values obtained from Student′s t-test. In all cases, the white arrows point to clusters of podosomes. |