
- Title
-
Differentiated melanocyte cell division occurs in vivo and is promoted by mutations in Mitf
- Authors
- Taylor, K.L., Lister, J.A., Zeng, Z., Ishizaki, H., Anderson, C., Kelsh, R.N., Jackson, I.J., and Patton, E.E.
- Source
- Full text @ Development
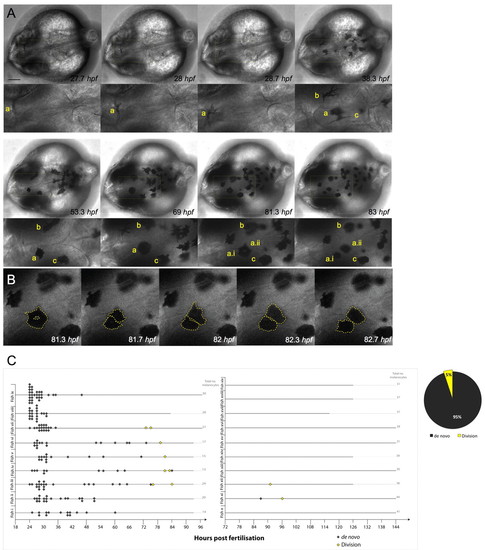
Melanocytes develop from undifferentiated precursor cells and from pigmented melanocytes. (A) Still images of time-lapse microscopy at the onset of melanocyte differentiation. Melanocytes emerge in the dorsal head as highly dendritic and pigmenting cells. Most melanocytes arise de novo from the neural crest and do not divide (melanocytes b,c). A few pigmented melanocytes divide (melanocyte a), becoming rounded before division (to become two cells: a.i, a.ii), which then move away from each other. Scale bar: 100 μm. (B) High-magnification image of pigmented melanocyte a division during a 1.3 hour interval, with cells outlined (broken yellow lines depict the approximate outline of the cells as analyzed through all z-stacks using enhanced contrast techniques). (C) Quantitative analysis of melanocyte development in individual fish (labelled i-ix) over 1-4 dpf show the majority of melanocytes are derived de novo from unpigmented precursor cells (n=166; grey diamonds) and a subpopulation of melanocytes derived from cell division events (n=8; yellow diamonds). Division events were charted for ten other fish examples (fish x-xix) from 3 to 5/6 dpf. Only three new melanocytes were identified during this time, two of which were from division events. Thick grey lines indicate length of each individual time-lapse movie for each embryo. |
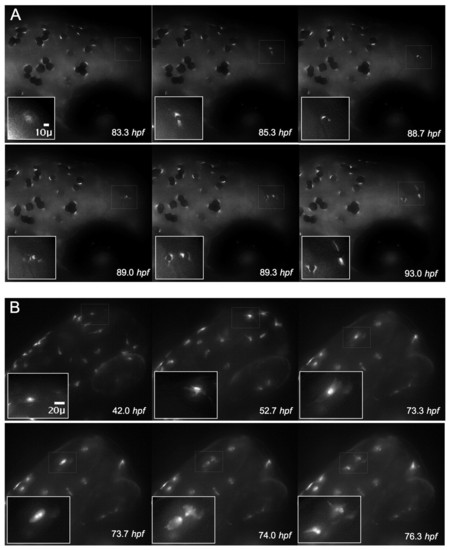
Visualization of the differentiation marker tyrp1-GFP during cell division. (A) Expression of tyrp1-GFP in the developing melanocyte allows for visualization of the melanocyte cytoplasm and precedes pigment formation (83.3 hpf, thin white box and inset). Continued monitoring of this cell reveals pigmentation (85.3 hpf), followed by rounding (88.7 hpf) and division (89.0 hpf). Two cells with distinct cytoplasm are visible (89.0 hpf) that migrate apart and become dendritic (93.0 hpf). (B) A single albino tyrp1-GFP cell (73.3 hpf) clearly revealed the presence of two nuclei in the same cell (73.7 hpf) prior to division (74.0 hpf). |
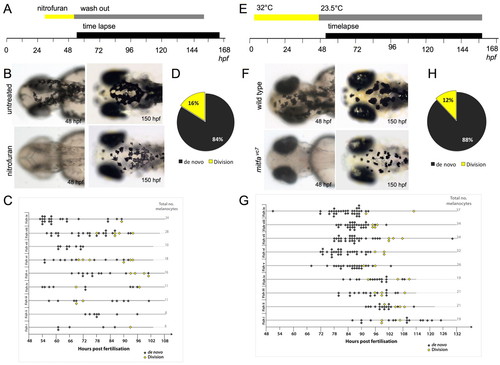
Melanocyte division events are enhanced during melanocyte regeneration. (A) Workflow of nitrofuran treatment from <30 hpf to 50 hpf to promote loss of differentiated melanocytes. After washout (grey bar), the embryos were immobilized in agarose and imaged by time-lapse microscopy (black bar). (B) Images of control and nitrofuran-treated embryos at the time of embedding in agarose and at the end of the time-lapse imaging. (C,D) Quantitative analysis of melanocytes derived de novo from unpigmented cells (grey diamonds; n=111) and from division of pigmented cells (yellow diamonds; n=21) in nine different zebrafish (i-ix). (E) Workflow of mitfavc7 temperature-sensitive experimental conditions. Zebrafish embryos with the mitfavc7 mutation grown at 32°C from 4 hpf until <48 hpf (yellow bar) do not develop ontogenic melanocytes. Upon shifting to the permissive conditions (grey bar), the embryos are immobilized in agarose and imaged by time-lapse microscopy (black bar). (F) Images of wild type and mitfavc7 embryos at the time of embedding in agarose and at the end of the time-lapse imaging. No neural crest-derived melanocytes are visible at 48 hpf (although non-neural crest pigmented cells in the eye remain pigmented) and melanocytes have repopulated the animal by 150 hpf. (G,H) Quantitative analysis of melanocytes derived de novo from unpigmented cells (grey diamonds; n=214) and from division of pigmented cells (yellow diamonds; n=29) in nine individual zebrafish (i-ix). |
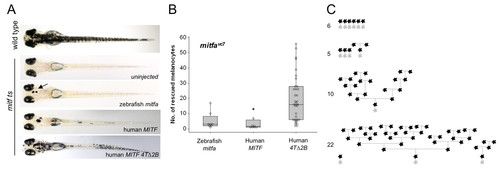
Human MITF 4TΔ2B promotes differentiated cell division. (A) Images of zebrafish embryos (day 5 postfertilization). Single-cell mitfavc7 embryos were injected with zebrafish mitfa, human MITF or human MITF4TΔ2B expressed from the mitfa promoter and grown at 30°C for 5 days. Uninjected mitfavc7 embryos were used as a control to monitor endogenous melanocyte development; no melanocytes developed in mitfavc embryos at 30°C (n=50). (B) Box plot of a representative experiment showing the range of melanocytes on individual zebrafish expressing zebrafish mitfa (n=8), human MITF (n=8) or human MITF4TΔ2B (n=35) from the mitfa promoter in mitfavc7 mutants grown at 30°C. Each data set has been repeated at least three times. Significance is observed within the dataset (P=0.001), analysis of variance (ANOVA). Post-hoc analysis shows significance between zebrafish mitfa and human MITF4TΔ2B; 95% confidence interval; 14.42 (2.03, 26.81), and between human MITF and MITF4TΔ2B; 95% CI; 16.04 (3.65, 28.43). (C) Schematic representation of melanocyte cell lineage analysis (as described in Fig. 5) for four embryos expressing MITF4TΔ2B. Total final number of melanocytes in imaged region is indicated. |
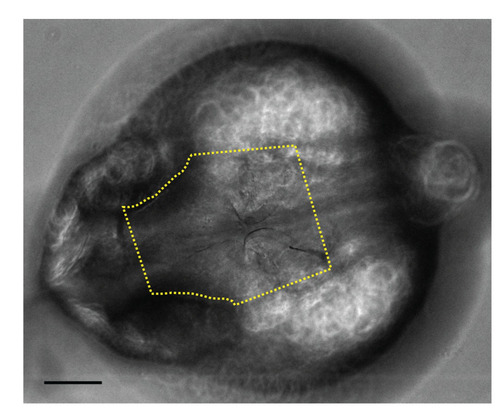
Melanocyte counting. All melanocyte counts took place on a defined head region, which extended from halfway between the eyes down to ears (yellow dotted line). Scale bar: 100 microns. |
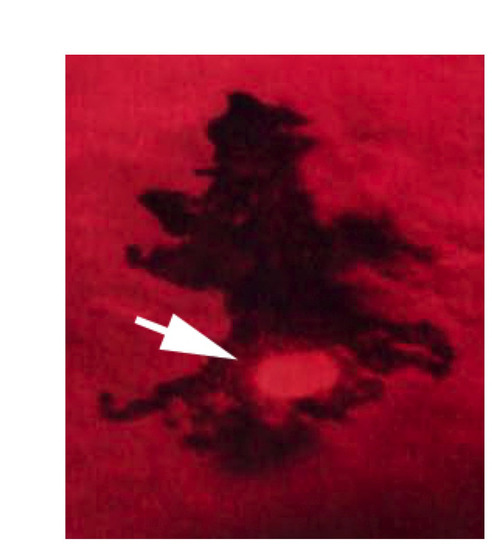
Pigmented embryonic melanocytes of trunk and tail are positive for the proliferative antigen phospho-Histone H3 (p-H3). p-H3-positive nucleus on dorsal yolk of 36 hpf embryo. p-H3-positive melanocytes were found at low frequencies in 28-36 hpf embryos sampled (2.0±2.7 cells per embryo, n=30). p-H3-expressing cells were found widely distributed throughout the embryo, and are likely to contribute to all of the embryonic melanocyte stripes. |
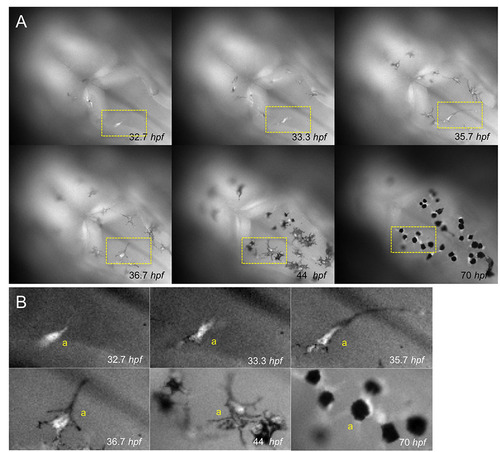
Tyrp1-GFP expression precedes melanocyte pigmentation. (A) Dorsal view of the head region of a zebrafish embryo expressing GFP from the tyrp1 promoter during melanocyte development. (B) Detail of the differentiating melanocyte (yellow boxes from A). One melanocyte (a) is followed from its differentiation from an unpigmented cell expressing GFP (32.7 hpf), through onset of pigmentation with enhanced dendricity (33.3 hpf), to the development of a mature melanocyte (70 hpf). |
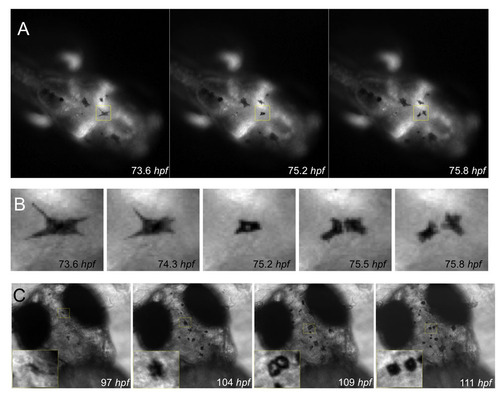
Division of pigmented cells. (A-C) Examples of division of pigmented cells during regeneration (A,B) after nitrofuran treatment and wash out, and (C) after shifting a mitfvc7 temperature-sensitive mutant from 32.0°C to the permissive temperature of <23.5°C as described in Fig. 4. |