
- Title
-
A novel xenograft model in zebrafish for high-resolution investigating dynamics of neovascularization in tumors
- Authors
- Zhao, C., Wang, X., Zhao, Y., Li, Z., Lin, S., Wei, Y., and Yang, H.
- Source
- Full text @ PLoS One
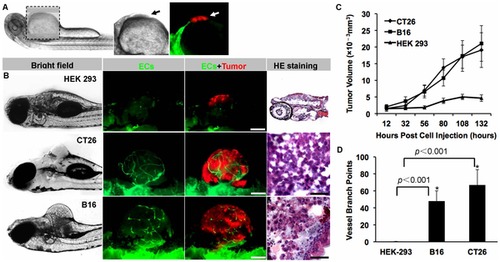
The establishment of mammalian tumor xenograft models in zebrafish. Red fluorescence-labeled malignant tumor cells (murine colon carcinoma CT26 and melanoma B16 cells) and non-tumorigenic HEK 293 cells were implanted into the abdominal perivitelline space (A, indicated by arrow) of 48 hpf Tg(flk1:EGFP) transgenic zebrafish embryos (50–100 cells/embryo). When tumors (B, red) reached 350–450 μm in diameter when filled with neo-vessels (B, green), the neoplasia were isolated and analyzed by H&E staining (B). The growth rate of xenografted tumors (C) and the number of tumor-induced neovessels (D) were analyzed quantitatively. * indicates the significant difference. Scale bar, 100 μm. |
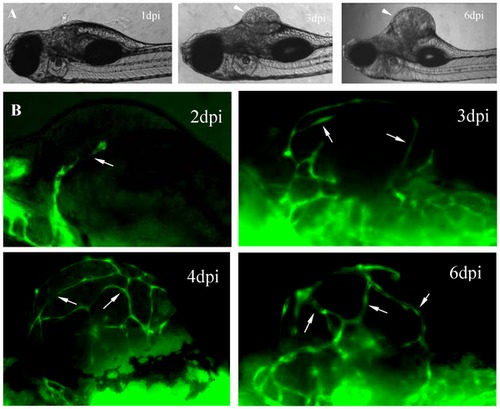
Dynamical observations of aniogenesis in B16 xenografts. The established microtumors (A, 3dpi and 6dpi panels) in zebrafish larvae are indicated by arrowheads. Neo-vessels are indicated by arrows (B). |
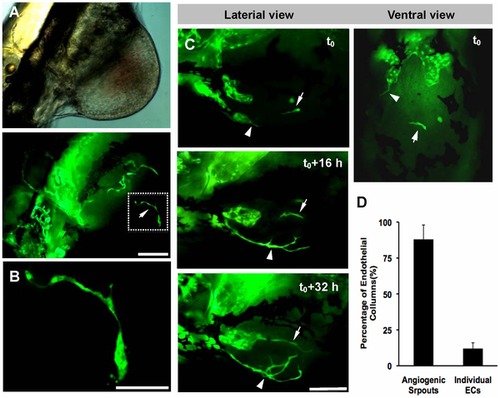
The participation of individual VEGFR2+ endothelial cells to the initial formation of tumor vascular network. Individual VEGFR2+ endothelial cells located at the center of B16 xenograft (indicated by arrow, A). The region in white dotted box was magnified in B. With the tumor growth (C), individual endothelial cells (arrows) increased its length and fused with angiogenic sprouts (arrowheads). (D) Histogram represents (n = 12, p<0.05) the percentage of endothelial columns that originated from the individual ECs or the angiogenic sprouts. Scale bar, 100 μm (A, C) or 50 μm (B). |
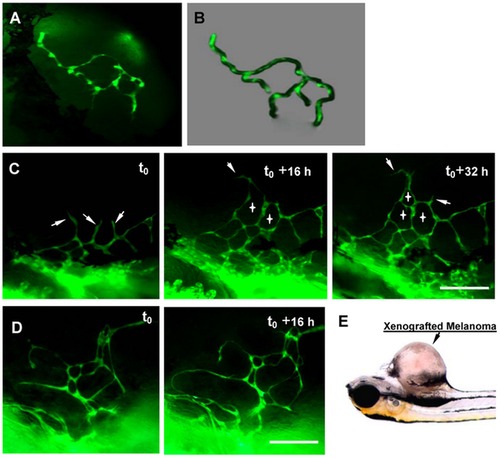
The formation of chaotic microvascular network in B16 xenografts. (A) The interconnection of initial endothelial cells that had penetrated into tumor tissue. (B) Schematic diagram showing the forming and formed endothelial loops. (C) The dynamic process of more and more endothelial loops assembling into a complex vascular network. Angiogenic sprouts were indicated by arrows, the formed endothelial loops were indicated by crosses. (D) Endothelial loops varied significantly in size and shape. The B16 xenograft is indicated by arrow (E). Scale bars, 200 μm. |
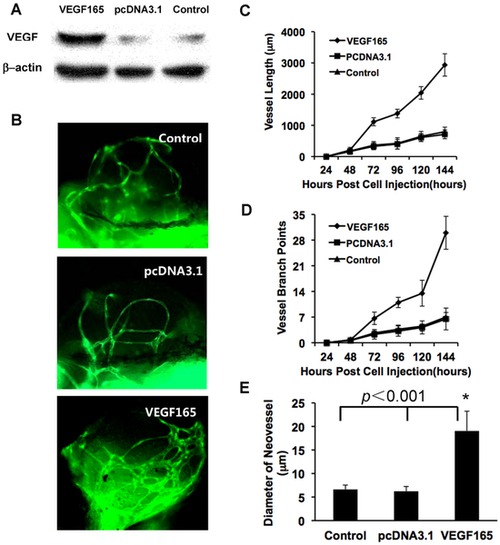
The over-expression of VEGF in B16 cells promoting tumor neovascularization. (A) Weston-blot revealed the expression of VEGF165 at 48 hours post transfection. (B) The tumor-induced neo-vessels were greatly affected by the over-expression of VEGF165 in B16 cells, (C–E) Statistical graphs revealed the changes of vessel length (C), vessel branch points (D) and mean diameters of neovessels (E). Scale bar, 100 μm. |
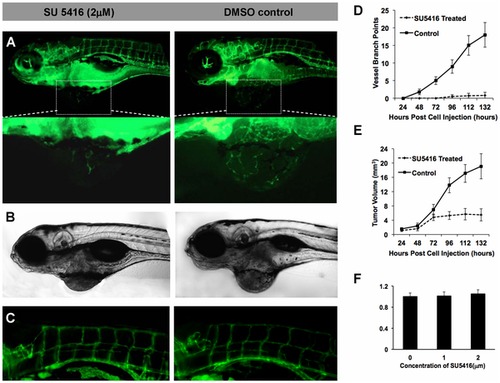
The small-molecular inhibitor of VEGFR2 inhibiting the tumor growth and neovascularization. (A–C) The imaging showed the obvious blockage of the specific inhibitor of VEGFR2, SU5416 (2 µM), to the neovascularization (A), tumor growth (B), and normal vascular vessels of zebrafish (C). (D,E) The quantitative analysis of the inhibiting effects of SU5416 to neovascularization (D) and tumor growth (E). (F) The result of MTT assay for B16 cells that treated by SU5416 for 48 hours in vitro at a concentration of 0, 1, 2 μM. Scale bar, 100 μm. |