
- Title
-
A novel role for MuSK and non-canonical Wnt signaling during segmental neural crest cell migration
- Authors
- Banerjee, S., Gordon, L., Donn, T.M., Berti, C., Moens, C.B., Burden, S.J., and Granato, M.
- Source
- Full text @ Development
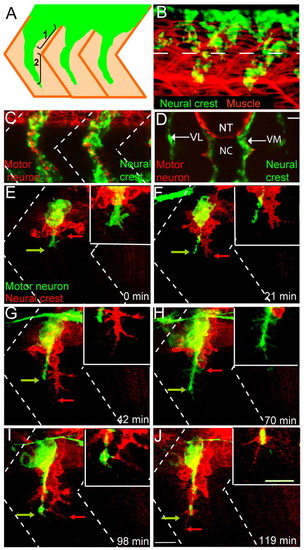
Wild-type neural crest and motor axon migration. (A) Schematic showing two stages of zebrafish neural crest cell migration: (1) initiation and (2) maintenance of segmental migration. Neural crest cells (green) migrate through a central region of the somites (tan). (B) Lateral view of a 22-hour-old embryo stained with a crestin riboprobe (green) marking neural crest cells and with F59 antibody marking adaxial muscle cells. Dashed lines mark the ventral boundary of the neural tube. (C) Lateral view of a 28-hour-old zebrafish embryo revealing neural crest cells in green (crestin riboprobe) and motor axons in red (znp-1/SV2 antibody cocktail). Dashed lines indicate approximate locations of somite boundaries. (D) Cross-sectional view of a 28 hpf embryo stained for neural crest cells (crestin) in green and motor axons (znp-1/SV2) in red. NT, neural tube; NC, notochord; VL, ventrolateral (or lateral) pathway; VM, ventromedial (or medial) pathway. Scale bar: 10 μm. (E-J) Still images from a time-lapse movie showing early co-migration of neural crest cells (red) and motor axons (green). Arrows point to filopodial extensions. Dashed lines indicate approximate locations of somite boundaries. Scale bar: 10 μm. See also Movie 1 in the supplementary material. |
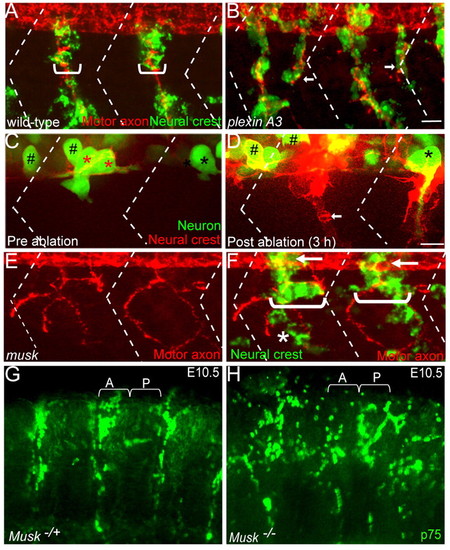
The role of motor axons and MuSK signaling during segmental neural crest cell migration. (A,B) Lateral views of 28 hpf wild-type (A) and plexin A3 mutant (B) zebrafish embryos with neural crest cells in green (crestin) and motor axons in red (znp-1/SV2). Brackets indicate width of neural crest cell stream. (C,D) Lateral views of a double Tg(mnx1:GFP)ml2; (sox10:mRFP)vu234 embryo expressing GFP (green) in motor neurons (asterisks) and in interneurons (hash marks), and mRFP (red) in neural crest cells before laser ablation (C) and three hours following motor neuron ablation (D; arrow points to ventral migration of neural crest cells). Red asterisks in C indicate ablated motor neurons. (E,F) Lateral views of a 28 hpf musk mutant embryo stained to reveal neural crest cells (crestin, green) and motor axons (znp1+SV2, red). Arrows point to migrating neural crest cells before they join the path shared with motor axons. In the musk mutant embryo, neural crest cells and motor axons deviate from their central path and migrate over a wider region of the somite (compare brackets in F with A; asterisk marks neural crest cells taking a path independent of motor axons). Dashed lines in A-F indicate approximate positions of somite boundaries. Scale bars: 10 μm. (G,H) Lateral views of whole-mount E10.5 mouse embryos stained with p75 antibody labeling neural crest cells. Neural crest cells migrate through the anterior sclerotome in the wild-type sibling embryo (A), but migrate non-segmentally in the Musk knockout embryo. A, anterior somite; P, posterior somites. |
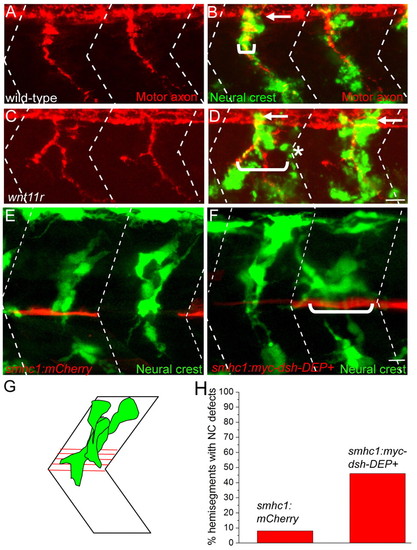
Inhibition of non-canonical Wnt and Dishevelled signaling disrupts neural crest migration. (A-D) Lateral views of 28 hpf wild-type and wnt11r zebrafish embryos stained to reveal neural crest cells (crestin, green) and motor axons (znp1+SV2, red). Arrows point to migrating neural crest cells before they join the path shared with motor axons. In the wnt11r mutant embryo, neural crest cells and motor axons deviate from their central path and migrate over a wider region of the somite (compare brackets in D with B; asterisks mark neural crest cells taking a path independent of motor axons). (E) Stochastic expression of mCherry (red) in slow muscle fibers does not affect neural crest cell (green) migration through the center of the somite. (F) Stochastic expression of Myc-Dsh-DEP+ (red) in slow muscle cells located either at horizontal myoseptum or dorsal to the horizontal myoseptum causes aberrant neural crest cell migration. Neural crest cells in E and F were visualized using Tg(mitfa:GFP)w47. (G) Location of horizontal myoseptum cells used for quantification of the phenotype. (H) Quantification of neural crest migration defect phenotypes. Dashed lines in A-F indicate approximate positions of somite boundaries. Scale bars: 10 μm. |
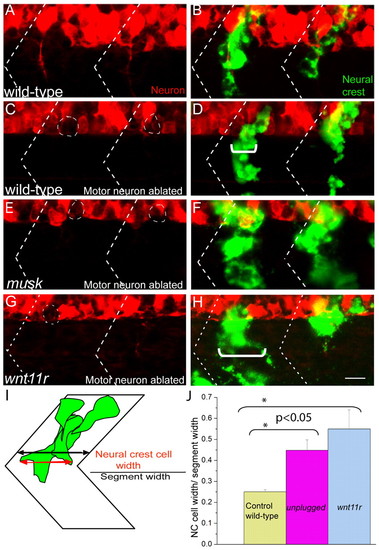
MuSK and Wnt11r signaling influences neural crest cell migration independent of motor axons. (A-D) In wild-type zebrafish embryos in which motoneurons were ablated (C,D), segmental neural crest cell migration is indistinguishable from that of wild-type embryos with intact motoneurons (A,B). (E-H) Neural crest cells migrate through a wider region of the somite (marked with white bracket) in motoneuron ablated musk (F) and wnt11r (H) mutant embryos, compared with the motoneuron-ablated wild-type control (C). Dashed circles in C, E and G indicate approximate positions of ablated motoneuron cell bodies. Dashed lines in A-H indicate approximate positions of somite boundaries. (I,J) Quantification of the neural crest cell migration phenotype in wild type, musk and wnt11r mutants was carried out by calculating the ratio of neural crest cell width (red arrow) with respect to segment width (black arrow; for details see Materials and methods). A minimum of five segments in which motoneurons were ablated were scored for each genotype, averaged and plotted with s.e.m. Scale bar: 10 μm. |
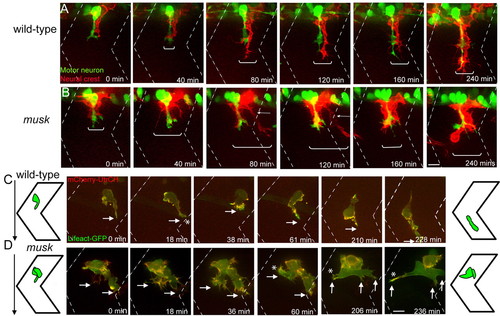
MuSK regulates maintenance of segmental neural crest migration. (A,B) Still images from time-lapse movies showing neural crest cells expressing membrane bound RFP [red, Tg(sox10:mRFP)vu234] and motor axons expressing GFP (green, Tg(mnx1:GFP)ml2) in wild-type (A) and musk mutant embryos (B). In musk mutants, neural crest cells migrate over a wider area of the somite (compare brackets between A and B). Mutant neural crest cells frequently form two streams, one migrating in close proximity to the motor axons, and one straying away from the central path towards the somite boundary (arrow). Scale bar: 10 μm. (C,D) Wild-type (C) and musk mutant (D) embryos expressing bioprobes for stable F-actin (mCherry-UtrCH) and total F-actin (Lifeact-GFP) in individual neural crest cells. A strong F-actin signal is visible at the leading front (arrow) of wild-type (C) and musk mutant (D) neural crest cells. Asterisks indicate filopodial projections towards somite boundaries (at 18 minutes in C; at 60, 206 and 236 minutes in D). Filopodial protrusions near the somite boundary are stabilized in the musk mutant embryo (marked by asterisk in D at 60, 206 and 236 minutes). Dashed lines indicate approximate positions of somite boundaries. Scale bars: 10 μm. See also Movies 2, 3, 4 and 5 in the supplementary material. |