
- Title
-
Assembly of Lamina-Specific Neuronal Connections by Slit Bound to Type IV Collagen
- Authors
- Xiao, T., Staub, W., Robles, E., Gosse, N.J., Cole, G.J., and Baier, H.
- Source
- Full text @ Cell
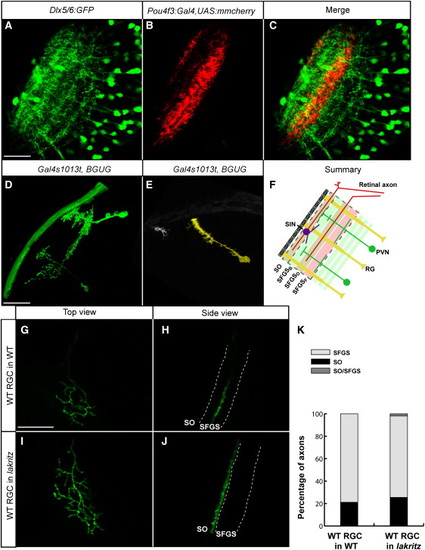
Axons, Dendrites, and Radial Glia Contribute to the Laminar Architecture of the Zebrafish TectumImages were taken at 6 dpf and are single optical sections (A–C) merged confocal Z stacks (projections) (D, E, and G–J).(A) Dlx5/6:GFP-labeled tectal neurons.(B) Pou4f3:Gal4 and UAS:mmCherry labeled RGC axons.(C) Merged image of (A) and (B).(D) Tectal neurons, sparsely labeled with Gal4s1013t and BGUG.(E) Radial glial cell and a superficial interneuron (SIN), labeled in the same tectum.(F) Schematic summary of the laminar composition of the larval tectum. Scale bars represent 20 μm.(G–J) Pou4f3:mGFP-positive, WT donor RGC transplanted into a nontransgenic host larva. Host was either the WT (G and H) or lakth241 (I and J). (G) and (I) are top views. (H) and (J) are rotated views of the confocal image stacks in (G) and (I) to best show axonal lamination.(K) Quantification of transplanted RGC laminar choices. Single axons behave very similarly in crowded (transplanted into the WT, n = 104) versus RGC-depleted (transplanted into lakth241, n = 52) conditions. |

Robo/Slit Signaling Is Required for RGC Axon Laminar Targeting(A–C) Single optical sections of the tectum in Pou4f3:mGFP transgenic larvae at 6 dpf. RGC axons (labeled with membrane-targeted GFP) remain in their target lamina in the WT (A) and cross the laminar boundaries in the astti272z mutant (B). (C) is a schematic summary.(D–F) Projections of confocal images of a WT (D) and astti272z (E) tectum in BGUG transgenic larva at 6 dpf. Image stacks were rotated to best show laminae. Arrows point at the axons leaving their target layer. Dashed lines indicate the skin overlaying the tectum. (F) is a schematic summary.(G–I) Single optical sections of the tectum in Pou4f3:mGFP transgenic larvae at 5 dpf. (G) is a control fish. (H) is a slit1a morphant. (I) is a schematic summary.(J–L) Projections of confocal images of the control (J) and slit1a morphant (K) tectum in BGUG transgenic larva at 5 dpf. (L) is a schematic summary.(M–O) Single optical sections of the tectum in Pou4f3:mGFP transgenic larvae. (M) is a control fish. (N) is a hsp70l:slit2-GFP transgenic carrier. Both were heat shocked at 76 hpf. (O) is a schematic summary.(P–R) Projections of confocal images of the control (P) and hsp70l:slit2-GFP (Q) tectum in BGUG transgenic larva at 6 dpf. Arrows point at axons projecting deeper than SFGS. (R) is a schematic summary.(S) Quantification of Pou4f3:mGFP RGC laminar position.(T) Quantification of RGC arbor thickness.***p < 0.001, **p < 0.05. The scale bar represents 20 μm. Error bars represent the standard error of the mean (SEM). See alsoFigure S1 and Table S1. |
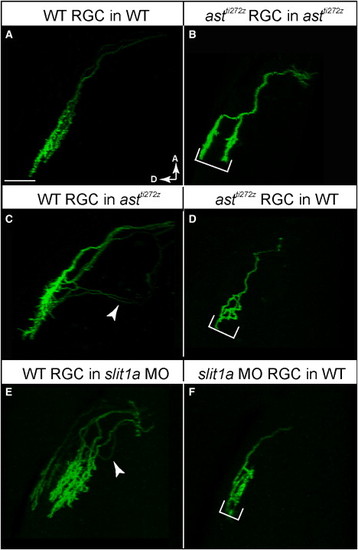
Robo2 Acts in a Retina-Autonomous Fashion, and Slit1 Acts Strongly in the Tectum and Weakly in the RetinaImages are projections of confocal image stacks, rotated to best show laminae. Fish were 5 dpf.(A) WT RGC transplanted into WT larva.(B) astti272z RGC transplanted into astti272z larva.(C) WT RGC transplanted into astti272z larva.(D) astti272z RGC transplanted into WT larva.(E) WT RGC transplanted into slit1a morphant.(F) slit1a morphant RGC transplanted into WT larva.Arrowheads point at mistargeted axons. Brackets indicate expanded arbor thickness. The scale bar represents 20 μm. See alsoFigure S2 and Table S2. |
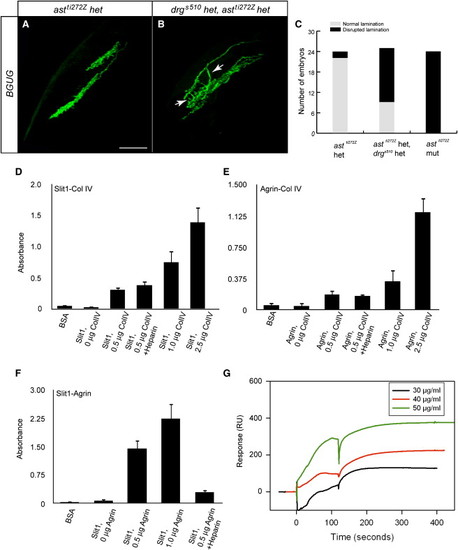
Collagen IV Interacts Genetically with, and Directly Binds to, Slit(A and B) Projections of confocal images of BGUG-labeled RGC axons in a WT (A) and a double-heterozygous carrier of drgs510 and astti272z (B) at 6 dpf. Arrows point at axons that trespass the laminae.(C) Quantification of RGC axon targeting defects.(D–F) Analysis of Col IV, Slit1 and Agrin interactions using solid-phase ELISA binding assays (n = 3, with duplicate samples in each experiment). Agrin and Slit1 bind Col IV via protein-protein interactions (HS independent, not inhibited by exogenous heparin), and Agrin binds Slit1 via its HS-GAG chains (marked reduction in presence of heparin).(G) Analysis of Col IV ligand binding to Slit1 using surface plasmon resonance. Col IV binds to Slit1 in a dose-dependent fashion, with KD = 0.65 nM.Error bars represent the SEM. See also Figure S3. |
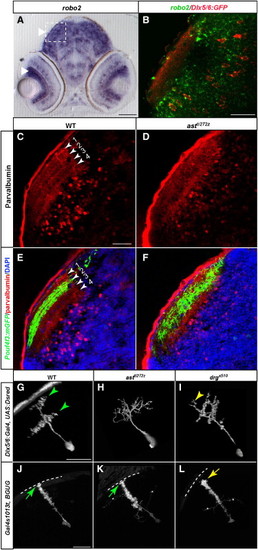
Tectal Dendrite Stratification Requires both Robo/Slit Signaling and Collagen IV(A) In situ hybridization, showing that robo2 mRNA is expressed in both RGCs and tectal neurons.(B) Double labeling of Dlx5/6:GFP (red) expressing tectal neurons and robo2 mRNA (green).(C and D) Sections of tectum labeled with anti-parvalbumin at 6 dpf. WT tectum (C) shows four distinct laminae. No lamination is detected in astti272z tectum (D).(E and F) Sections of WT (E) and astti272z (F) tectum labeled with anti-parvalbuminin (red), anti-GFP (green) and DAPI (blue). Laminae are numbered in (E) as in (C).(G–I) Projections of confocal images of tectal neurons, transiently labeled with Dlx5/6:Gal4 and UAS:Dsred at 6 dpf. In the WT (G), neurites are organized into two laminae. In astti272z (H), no lamination is detectable. In drgs510 (I), the two laminae are more closely spaced, and ectopic neurites extend outside the superficial layer.(J–L) Radial glial endfeet attachment requires Col4a5. Projections of confocal images of radial glia in the WT (J), astti272z (K) and drgs510 (L) at 6 dpf.Arrows point at the endfeet anchored within the basement membrane. Asterisks (*) indicate processes from other cells. Scale bars represent 40 μm in (A) and 20 μm in (B), (C), (G), and (J). |
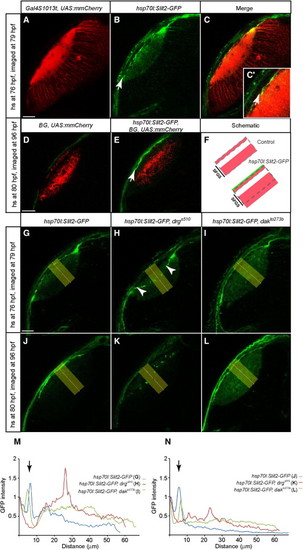
Slit Localization in the Optic Tectum Requires Col4a5 but Not HSPGs(A–C) Optical section of a 79 hpf hsp70l:Slit2-GFP, Gal4s1013t, and UAS:mmCherry tectum, heat shocked at 76 hpf. Many tectal neurons are labeled with mmCherry (red, A). Slit2-GFP (green, B) is enriched at the surface of the tectal neuropil (arrow). (C) is a merged image.(D–F) Optical sections of 96 hpf hsp70l:Slit2-GFP, Pou4f3:Gal4 (Brn3c:Gal4, BG), and UAS:mmCherry tecta, heat shocked at 80 hpf. RGC axons (red) are shown in non-heat-shocked (D) and heat-shocked fish (E). Arrow points at the accumulation of Slit2-GFP superficial to SO. (F) is a schematic summary.(G–L) Optical sections of hsp70l:Slit2-GFP tecta in the WT (G and J), drgs510 (H and K), and dak t0273b (I and L). Larvae were either heat shocked at 76 hpf and imaged at 79 hpf (G–I) or heat shocked at 80 hpf and imaged at 96 hpf (J–L).(M and N) Densitometric plots of GFP intensity in the yellow rectangle areas in (G)–(L). (M) shows distribution 3 hr after induction. N shows distribution 16 hr after induction. Intensity is normalized to skin autofluorescence level (first peak at 0 μm). In the WT, Slit2-GFP accumulates beneath the skin (second peak at ~8 µm from the surface, indicated by arrows) and is cleared from the neuropil. In drgs510, Slit2-GFP accumulates in the neuropil, away from the surface. In dak t0273b, Slit2-GFP is surface-localized, but remains also in the neuropil.Scale bars represent 20 μm. See also Figure S4. |
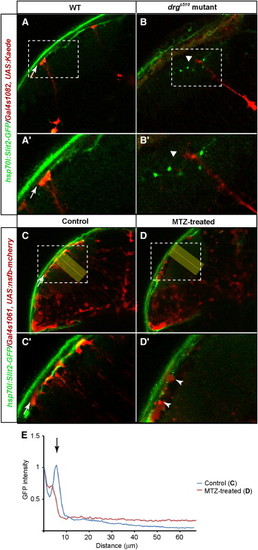
Radial Glia Are Required for the Surface Localization of Slit in the TectumOptical sections of 4 dpf hsp70l:Slit2-GFP tecta. Larvae were heat shocked at 79 hpf and imaged at 96 hpf.(A and B) Radial glia were labeled with Gal4s1082t and UAS:Kaede. Kaede was photoconverted to red. (A2) and (B2) show higher magnifications of the areas marked with dashed lines in (A) and (B), respectively. Arrows point at radial glial endfeet in the WT (A and A2). Triangles point at the distal ends of radial glia in drgs510 (B and B2).(C and D) Radial glia were labeled with Gal4s1061t and UAS:nfsb-mCherry. (C) shows control larva treated with 1% DMSO (C2, higher magnification). (D) shows larva treated with 10mM MTZ (D2, higher magnification). Arrows point at radial glial endfeet (C and C2). Arrowheads point at degenerated radial glia (D2).(E) Densitometric plots of Slit2:GFP signal intensity from the areas indicated by yellow rectangles. Measurement and normalization as in Figures 6M and 6N. Scale bars represent 20 μm. See also Figure S5. |
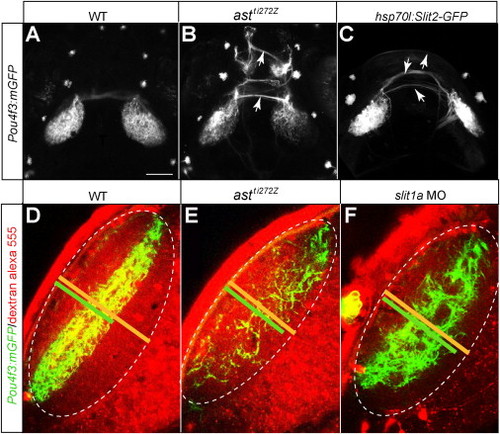
RGC Axon Projections Require Slit/Robo Signaling, Related to Figure 2(A–C) Projections of 6 dpf Pou4f3:mGFP WT (A), astti272z (B), and hsp70l:Slit2-GFP fish (C). Heat shock was applied at 76 hpf.(D–F) Optical sections of tectum of 5 dpf Pou4f3:mGFP fish. Arrows point at RGC axons aberrantly crossing midline. Pou4f3:mGFP-labeled RGC axons occupy about 60% of the depth of the tectal neuropil (D). In both astti272z mutant (E) and slit1a MO (F), Pou4f3:mGFP-labeled RGC axons are more dispersed in the tectal neuropil. Yellow lines in D to F indicate the depth of the tectal neuropil. Green lines in D to F indicate the depth of Pou4f3:mGFP expressing RGC axons. |
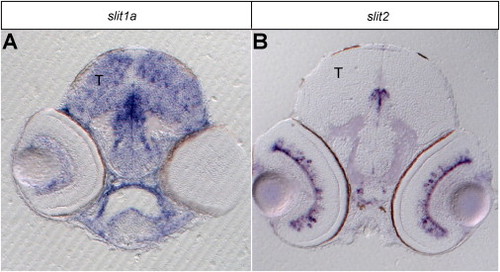
slit1a and slit2 Expression Patterns in Tectum and Retina, Related to Figure 3Sections of RNA in situ hybridizations of 4 dpf larvae.(A) slit1a is weakly expressed in some RGCs and in many tectal cells.(B) slit2 is in a small subset of amacrine cells in the retina and is absent from the tectum. T is tectum. |
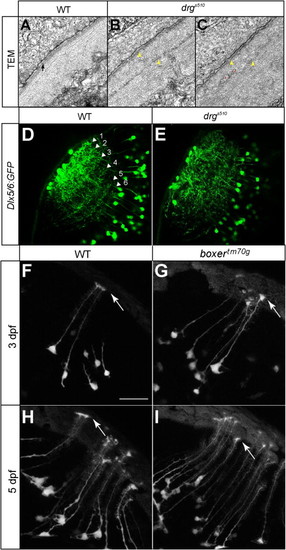
Lamination of Tectal Dendrites Is Disrupted in drgs510 Mutants and Radial Glia Appear Morphologically normal in box Mutants, Related to Figure 5(A–C) TEM photographs of the basement membrane of WT (A) and drgs510 (B, C) tectum at 5 dpf. The arrow in A points at the lamina densa in WT. Yellow arrowheads in B and C point at the putative lamina densa in drgs510 tectum(B, C). Instead of a smooth lamina densa, which contains type IV Collagen, two thin electron-dense layers are present in drgs510. Red stars indicate neurites, probably axonal profiles, aberrantly projecting into the ECM near the surface. Scale bar is 0.5 µm.(D and E) Single optical sections of Dlx5/6:GFP transgenic fish at 6 dpf. The WT pattern (D) shows six laminae. In drgs510 (F), these laminae are present but more diffuse, and the superficial-most terminations are disrupted.(F–I) Projections of radial glia in Gal4s1082t crossed to UAS:Kaede in WT (F, H) and boxtm70 g (G, I) at 3 dpf (F, G) and 5 dpf (H, I). Arrows point to glial endfeet. Radial glia and their endfeet appear normal in the mutant. Scale bar (in F, for panels F-I) is 10μm. |
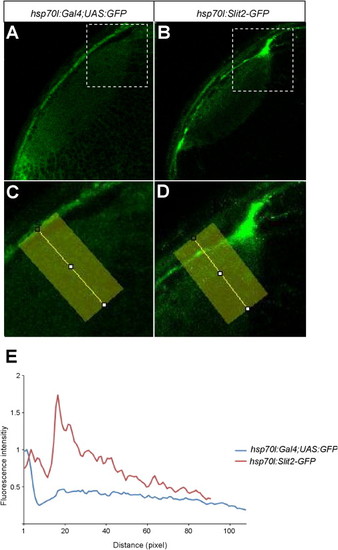
Heat Shock-Induced GFP Expression Is Spatially Uniform, Related to Figure 6(A–D) Optical sections of the tectum in 3 dpf embryos. Genotypes as indicated in the panels. C and D shows higher magnifications of the boxed regions in A and B, respectively.(E) Densitometric plots of GFP intensity from the areas indicated by yellow rectangles. Intensity is normalized to skin autofluorescence level (first peak at about 5 pixels from surface). While GFP is evenly distributed in the neuropil after induction, Slit2-GFP accumulates beneath the skin (second peak at 18 pixels of the red trace). Ten pixels correspond to ca. 5 μm. |
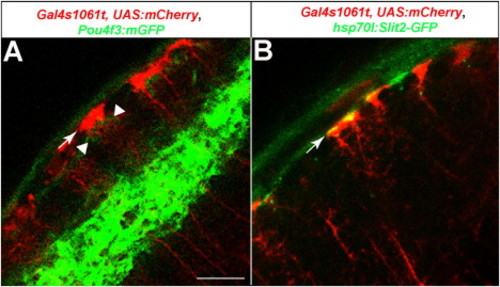
The Position of Radial Glial Endfeet Relative to RGC Axons and Slit2-GFP, Related to Figure 7 Optical sections of a 6 dpf tectum.(A) Radial glia, labeled with Gal4s1061t crossed to UAS:mmCherry (red), and RGC axons, labeled with Pou4f3:mGFP (green). Endfeet (arrow) are in close proximity and slightly superficial to the thin layer of RGC axons in the SO (weak green signal, indicated by arrowheads). The strong green signal in the deeper neuropil corresponds to the two SFGS sublayers, SFGSD and SFGSF, where most Pou4f3:GFP axons are projecting.(B) Radial glia, labeled with Gal4s1061t crossed to UAS:mmCherry (red) and heatshock-induced Slit2-GFP (green). The Slit2-GFP signal coincides with, and appears to be enriched around, the glial endfeet (arrow). |
Reprinted from Cell, 146(1), Xiao, T., Staub, W., Robles, E., Gosse, N.J., Cole, G.J., and Baier, H., Assembly of Lamina-Specific Neuronal Connections by Slit Bound to Type IV Collagen, 164-176, Copyright (2011) with permission from Elsevier. Full text @ Cell