
- Title
-
Intercellular bridges in vertebrate gastrulation
- Authors
- Caneparo, L., Pantazis, P., Dempsey, W., and Fraser, S.E.
- Source
- Full text @ PLoS One
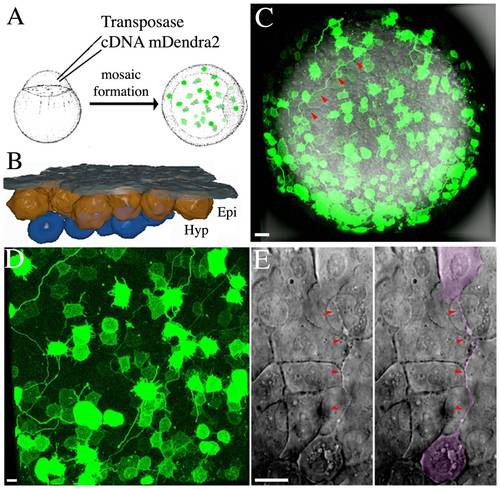
Cellular Bridge Visualisation During Gastrulation. (A) Schematic illustration of the methodology used to generate mosaic embryos with high levels of mDendra2 expression using Tol2 transposase mediated integration of an expression vector. (B) Schematic cross section of an idealized embryo at mid-gastrula stage showing the relationship between the enveloping layer (EVL; dark grey), the epiblast (Epi; orange) and the underlying migrating hypoblast (Hyp; blue). (C) Animal pole of a mosaic zebrafish embryo expressing mDendra2 at the onset of gastrulation. (D) Portion of the animal pole view, showing details of the epiblast layer with intercellular bridges depicted in D, at higher magnification. (E) DIC image of an un-injected embryo showing two epiblast cells connected by an intercellular bridge (red arrow) and highlighted in the right panel of the image in magenta. Schematics are not to scale. Scale bar (C–E): 20 μm. |
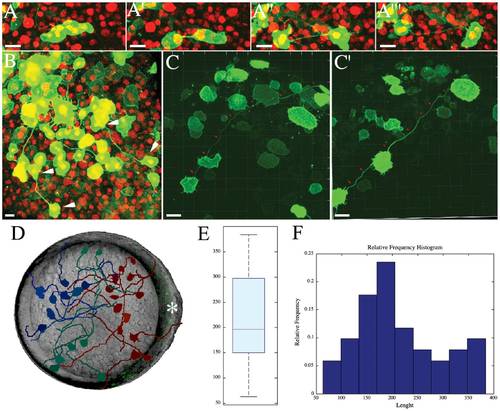
Intercellular Bridge Formation and Embryo Distribution. (A-A′′ ′) Image series from a confocal time-lapse of a dividing cell forming an intercellular bridge during the blastula stage. Nuclei are labeled with H2B-mCherry (in red) and mDendra2 (in green) highlights the cellular boundary (see also Movie S1). (B) Animal pole view of blastula zebrafish showing several pairs of interconnecting cells (white arrows). (C, C′′) Persistence of the intercellular bridge (red arrow) from mid-gastrula (C) to the end of gastrulation (C′) (see also Movie S2). (D) Schematic showing several intercellular bridges mapped in an ideal embryo, shown here in an animal pole view. Different colors show different portions of the embryos: (red) neural plate region; (dark blue) non-neural territory; (green) presumptive lateral plate. The subdivision into territories has been made aligning each embryo by the embryonic shield and the anterior neural border. The dorsal side of the idealized embryo is shown by the white asterisk (*). (E, F) Quantification of the length of the intercellular bridges at midgastrula. (E) The boxplot shows the median length of intercellular bridges (red line). The first quartile (blue box) and the minimum and maximum value of the intercellular bridges (whiskers) are depicted for a total of n = 30 cells from 20 independent embryos. The average length of the intercellular bridges is 215 μm. (F) The histogram shows the same distribution represented in the boxplot. Scale bar (A-C′): 20 μm. |
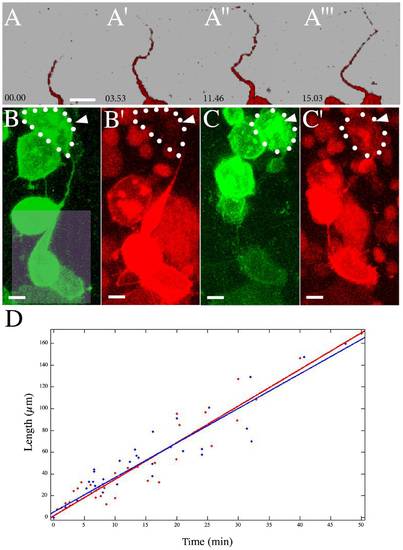
Membrane Dynamics of Intercellular Bridges. (A-A′′ ′) Time-lapse rendering of photoconverted mDendra2 diffusing along the intercellular bridges (see also: Movie S4 and S6). (B-C′) Membrane transfer of photoconverted protein in embryos labeled with mDendra2. We photoconverted mDendra2 with a 405 nm light [7], which shifts the emission and excitation spectra. (B, B′) Non-converted mDendra2 positive cells are in green (B), and photoconverted cells are in red, with H2B-mCherry highlighting the nuclei (B′). The light square in (B) shows the region of photoconversion. (C-C′) The same cells are connected via an intercellular bridge. The pool of photoconverted mDendra2 reaches the cell at the opposite end of the intercellular bridge, indicated by the white arrowhead and white dotted outline. (D) Quantification of the dynamics — length as function of time — of a pool of photoconverted mDendra2 along the intercellular bridge (time in minute and length in μm). Scattered red and blue dots represent the raw data for mDendra2 and CD8-Dendra2, respectively. The curve fitting was performed using CurveFittingTool in MATLAB, and each curve has an R2 value of at least 0.9. Scale bar (A-C′): 10 μm. |
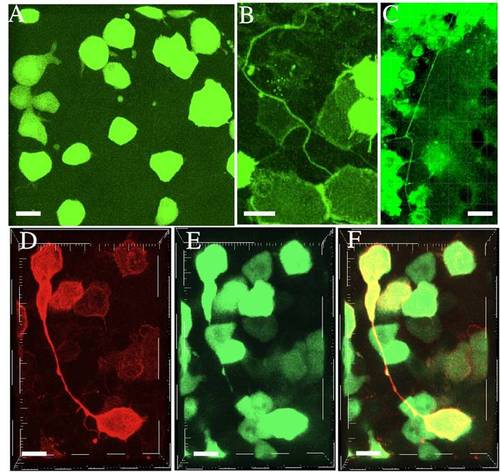
Intercellular Bridge Properties. (A) Animal pole view of a mosaic zebrafish embryo expressing Dendra2 at the onset of gastrulation. Note that intercellular bridges cannot be visualised even under intense 488 nm illumination of the cytoplasmic fluorescent protein. (B, C) Intercellular bridges visualised at tailbud stage (B) and 3 somites stage (C). (D–F) Intercellular bridge connecting two cells (white arrowheads) labelled with membrane targeted mCherry (D), EGFP-β-Actin (E), and overlay (F). Note that EGFP-β-Actin is partially present inside the intercellular bridge. Scale bar: 20 μm. |