
- Title
-
Targeting zebrafish and murine pituitary corticotroph tumors with a cyclin-dependent kinase (CDK) inhibitor
- Authors
- Liu, N.A., Jiang, H., Ben-Shlomo, A., Wawrowsky, K., Fan, X.M., Lin, S., and Melmed, S.
- Source
- Full text @ Proc. Natl. Acad. Sci. USA

Pituitary pathology of zPttg transgenic zebrafish, Tg:Pomc-zPttg. (A) Top: Schematic representation of Pomc-zPttg transgene. Bottom: Pituitary expression of zPttg in Tg:Pomc-zPttg zebrafish at 72 hpf. F1 Tg:Pomc-zPttg transgenic zebrafish were crossed with WT zebrafish, resulting in F2 embryos with 50% of the progeny positive (Left, Tg), and 50% negative (Right, WT) for pituitary zPttg expression assessed by whole-mount in situ analysis (ventral view, with anterior aspect to the left). (B) Tg:Pomc-Pttg embryos showed increased Tpit/Tbx19 expression, whereas no significant change of Pit-1 expression by whole-mount in situ analysis at 48 hpf. Antisense mRNA probes are indicated at right lower corner of each panel. Top, Lateral view; Middle and Bottom, ventral view, anterior aspect to the left. (C) Tg:Pomc-Pttg; POMC-eGFP embryos exhibited increased pituitary eGFP signal, and are more resistant to Gc-negative feedback than Tg:Pomc-Pttg–negative siblings. Double transgenic embryos (Tg:Pomc-Pttg; POMC-eGFP) were generated by breeding Tg:Pomc-Pttg fish with an established transgenic line POMC-eGFP, wherein eGFP expression is driven by the same zPomc promoter. Fluorescence intensity of POMC-GFP–positive cells was measured in live embryos after dexamethasone treatment at 4 dpf. (D) Pituitary hematoxylin/eosin stain (Top) and ACTH immunohistochemistry (Bottom) of sections derived from WT and Tg:Pomc-Pttg transgenic fish (Tg) at 20 mo. Red arrows indicate neoplastic mitotic ACTH-expressing cells. (E) Tg:pomc-pttg pituitary exhibited increased number of PCNA and ACTH coexpressing cells. Representative confocal pituitary images of fluorescence immunohistochemistry detecting PCNA (red) and ACTH (green) expression in Tg:Pomc-Pttg (a–c) and WT (d–f) zebrafish. Paraffin slides were counterstained with DAPI (blue). Arrow-heads indicate ACTH-producing cells coexpressing intranuclear PCNA. PCNA index was calculated in WT and Tg:Pomc-Pttg pituitary (g) (mean ± SE, n = 500 cells counted per pituitary, two pituitaries per group; *P = 0.05). AP, anterior pituitary; IP, pars intermedia. P, pituitary. (Scale bar, 50 μm.) |
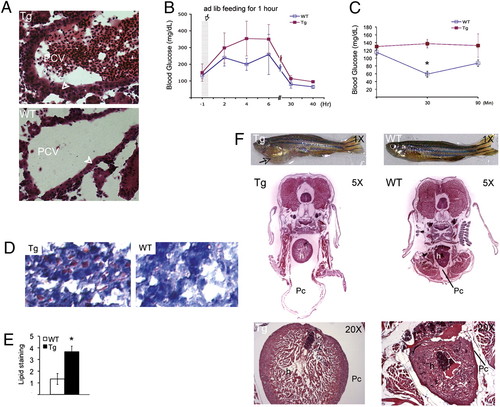
Tg:Pomc-Pttg transgenic zebrafish develop hypercortisolism, exacerbated insulin resistance, glucose intolerance, hepatic steatosis, and cardiomyopathy. (A) Tg:pomc-pttg (Top, Tg) fish showed steroidogenic cell expansion as depicted by H&E stain of kidney head paraffin slides. Zebrafish Gc steroidogenic cells are arranged as epithelial cell layers (arrowheads) in association with the renal head posterior cardinal vein (27). Tg:pomc-pttg fish also showed blood cell accumulation within the posterior cardinal vein, which was not observed in WT (Bottom). (B) Glucose tolerance tests were performed in 72 Tg:pomc-pttg and WT fish. Zebrafish were given ad libitum feeding of regular diet for 1 h (gray column) after 16 h of fasting. Glucose levels are presented as mean ± SE (area under the curve; P < 0.0001). (C) After 20 h of fasting, zebrafish were intraperitoneally injected with insulin (0.1 U/100 mg), and blood glucose levels were measured at 30 and 60 min after insulin injection (n = 24, mean ± SE; *P < 0.01). (D) Oil red O staining of liver sections reveal hepatic lipid accumulation in Tg:Pomc-pttg transgenic fish. (E) Area distribution and intensity of hepatic oil red O staining were scored as described in SI Methods (mean ± SE; *P < 0.01). (F) Top: Tg:Pomc-pttg zebrafish (Tg) with gross pericardial fluid accumulation (arrow) compared with WT at 24 mo. Middle: H&E stain of midbody cross section. Bottom: High magnification (20×) showing ventricular hypertrophy of the heart. Tg, Tg:Pomc-Pttg; Pc, pericardial space; h, heart. (Scale bar, 50 μM.) PHENOTYPE:
|
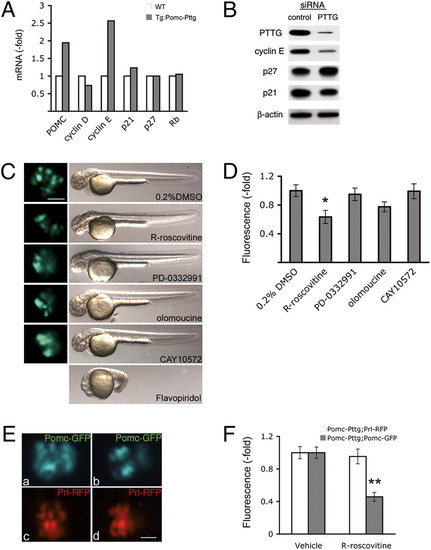
In vivo drug testing in Tg:Pomc-Pttg zebrafish. (A) Pttg overexpression directed by zebrafish Pomc promoter induced cyclin E up-regulation in Tg:Pomc-Pttg transgenic pituitary at 3 mo. mRNA levels were assayed by quantitative real-time PCR (mean ± SE of relative expression; n = 30 pituitaries for each group). (B) Western blot of mouse corticotroph tumor AtT20 cells transfected with a control or PTTG siRNA. (C) In vivo treatment of Tg:Pomc-Pttg;Pomc-eGFP embryos with small-molecule CDK inhibitors (50 μM) or 0.2% DMSO as control from 18 to 40 hpf. One hundred to one hundred fifty embryos were treated with each compound. Representative images of live embryos are shown with gross morphology (Right) and pituitary Pomc-GFP–positive cells at higher magnification (Left) at 40 hpf. Embryos exposed to flavopiridol developed early developmental defect before pituitary POMC cell ontogeny occurs. (D) Relative expression of pituitary Pomc-eGFP fluorescence analyzed using Volocity 5.2 software (Improvision; mean ± SE of relative expression, n = 7). (E) R-roscovitine specifically suppresses expansion of pituitary POMC cells overexpressing zPttg from 18 to 48 hpf. Double transgenic Tg:Pomc-Pttg;Prl-RFP embryos were generated by breeding Tg:Pomc-Pttg fish with a previously generated PRL-RFP transgenic line, in which RFP was targeted to pituitary lactotrophs by a zebrafish Prolactin promoter (34). Representative fluorescent microscopy of pituitary POMC-eGFP (a and b) and PRL-RFP (c and d) expression in live Tg:Pomc-Pttg;Pomc-eGFP and Tg:Pomc-Pttg;Prl-RFP embryos treated with 0.2% DMSO (a and c) or 50 μM R-roscovitine (b and d). (F) Relative expression of pituitary POMC-eGFP or PRL-RFP fluorescence were analyzed (mean ± SE of relative expression; n = 10). Results represent one of three similar experiments; *P < 0.02 and **P < 0.000005. (Scale bar, 50 μm.) |