
- Title
-
Flt1 acts as a negative regulator of tip cell formation and branching morphogenesis in the zebrafish embryo
- Authors
- Krueger, J., Liu, D., Scholz, K., Zimmer, A., Shi, Y., Klein, C., Siekmann, A., Schulte-Merker, S., Cudmore, M., Ahmed, A., le Noble, F.
- Source
- Full text @ Development
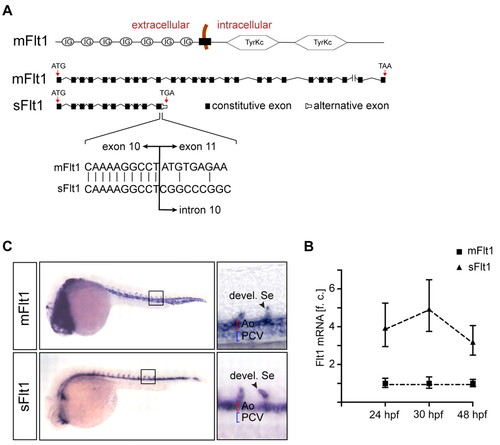
Expression of flt1 isoforms in zebrafish embryos. (A) Structural organization of membrane-bound flt1 (mflt1) and soluble flt1 (sflt1). sflt1 contains a unique mRNA sequence, not present in mflt1, that encodes the 5′ region of intron 10. (B) Taqman analysis shows higher expression of sflt1 than mflt1 in control embryos at 24 hpf, 30 hpf and 48 hpf. f.c., fold change relative to mflt1 expression at indicated time-points. Error bars indicate s.e.m. (200 embryos/group from four separate experiments). (C) Whole-mount in situ hybridization with antisense riboprobes directed against mflt1 or sflt1; embryos at 30 hpf. Note that mflt1 is expressed in segmental sprouts, aorta and cardinal vein; sflt1 is expressed in segmental sprouts and aorta. Ao, dorsal aorta; PCV, posterior cardinal vein; Se, segmental artery. |
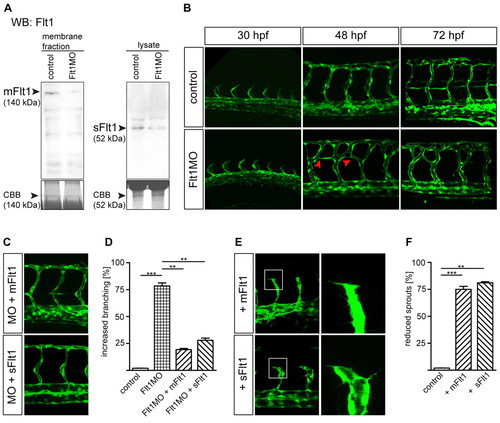
Flt1 regulates segmental vessel branching morphogenesis. (A,B) Reduced mFlt1 and sFlt1 protein levels (A) and excessive segmental vessel branching (B) in zebrafish flt1 morphants. The red arrowheads in B indicate the aberrant connection between adjacent segmental vessels. (C,D) Injection of mRNA encoding mflt1 or sflt1 rescued segmental branching defects in flt1 morphants. MO, flt1 ATG morpholino. y-axis shows percentage of examined embryos with aberant segmental vessel branching, as shown in B (lower middle panel; 120 embryos/group from four separate experiments). (E,F) Overexpression of mflt1 (top row) or sflt1 (bottom row) in control embryos results in short segmental artery sprouts (E, left) and reduced filopodia extensions (E, right). The boxed regions are shown at higher magnification in the right-hand panels. y-axis shows percentage of embryos with reduced segmental vessel sprouts, as shown in E. **, P<0.01; ***, P<0.001; Student′s t-test. Error bars indicate s.e.m. (120 embryos/group from three separate experiments). EXPRESSION / LABELING:
PHENOTYPE:
|
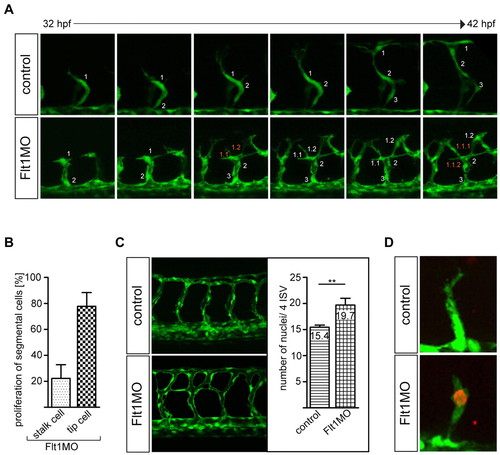
Flt1 regulates endothelial tip cell formation. (A,B) Time-lapse in vivo imaging shows increased tip cell numbers and proliferating endothelial tip cells in segmental vessels of zebrafish flt1 morphants. Note that in flt1 morphants the leading cell number 1 gives rise to two progeny cells termed 1.1 and 1.2. y-axis shows the percentage of examined flt1 morphants with proliferation in tip or stalk cells. (C) Quantification of endothelial cell numbers in four consecutive segmental vessel (ISV) – dorsal longitudinal anastomotic vessel (DLAV) loops reveals an increase in flt1 morphants. (D) Anti-phospho-histone H3 staining confirms endothelial proliferation in segmental vessels of flt1 morphants. **, P<0.01; Student′s t-test. Error bars indicate s.e.m. |
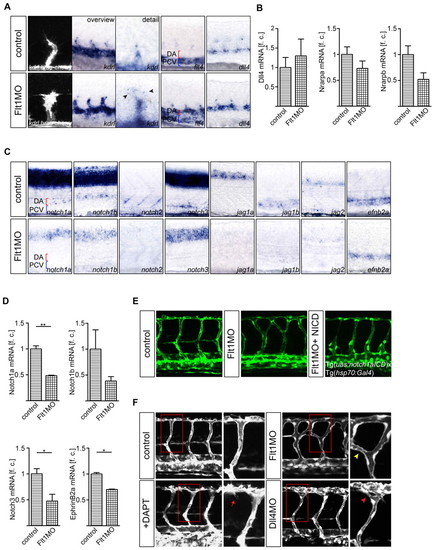
Tip and stalk cell marker expression and Notch signaling in flt1 morphants. (A,B) Expression of kdrl, flt4 and dll4 in control and flt1 morphants. Expression of the tip cell marker kdrl in segmental sprouts in Tg(kdrl:hras-mcherry)s896 transgenic zebrafish embryos (A, left) and kdrl in toto in situ hybridization (A, overview and detail). Note the ectopic expression of flt4 in the dorsal aorta of flt1 morphants (A, fourth panel). Expression of the stalk cell markers nrarpa and nrarpb is reduced, but expression of dll4 is maintained in morphants (A, fifth panel; B). (C,D) In situ hybridization and Taqman analysis of the trunk region show reduced expression of the receptors notch1a, notch1b, notch2 and notch3 and of the Notch ligands jag1a, jag1b and jag2 in flt1 morphants. Reduced expression of efnb2a suggests loss of Notch signaling in flt1 morphants. (E) Conditional overexpression of notch1a intracellular cleaved domain (NICD) in flt1 morphants (right) rescues segmental arterial branching defects. (F) Segmental branching pattern in dll4 morphants (red arrowhead) or in embryos treated with the Notch γ-secretase inhibitor DAPT (red arrow) did not phenocopy the branching pattern of flt1 morphants (yellow arrowhead). The boxed regions are shown at higher magnification in the right-hand panels. DA, dorsal aorta; PCV, posterior cardinal vein. *, P<0.05; **, P<0.01; Student′s t-test. Error bars indicate s.e.m. f.c., fold change relative to age-matched control embryos. |
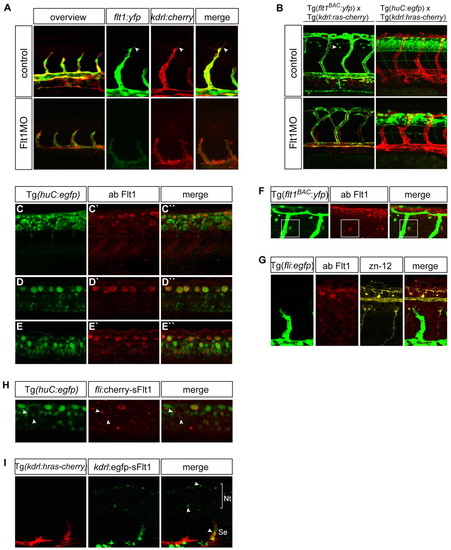
Distribution of Flt1 in vessels and nerves. (A) Comparison of flt1BAC:yfp and kdrl:cherry expression in segmental artery sprouts of 30 hpf Tg(kdrl:ras-cherry)s916 × Tg(flt1BAC:yfp) double-transgenic zebrafish embryos, in controls (top row) and flt1 morphants (bottom row). In controls, note the overlap of flt1BAC:yfp and kdrl:cherry expression in tip and stalk cells. At 30 hpf, expression of flt1BAC:yfp is restricted to the vascular compartment. After injection of flt1 ATG-blocking MO, expression of flt1BAC:yfp in sprouts appears less intense, but is not completely lost. (B) Injection of flt1 ATG-blocking MO in Tg(kdrl:ras-cherry)s916 × Tg(flt1BAC:yfp) double-transgenic embryos causes hyperbranching of segmental vessels and affects neurons. In controls at 48 hpf, flt1BAC:yfp marks segmental vessels and a subset of spinal cord neurons (arrowhead). Injection of the flt1 ATG-blocking MO induces aberrant vessel patterning and the neuronal flt1BAC:yfp expression domain is reduced. Injection of the flt1 ATG-blocking MO in Tg(kdrl:hras-mcherry)s896 × Tg(huC:egfp) double-transgenic embryos affects neurons. (C-E3) Flt1 immunostaining in Tg(huC:egfp) neuronal reporter embryos shows Flt1 throughout the neural tube. Overview of neural tube (C-C3) and different focal planes from dorsal to ventral (D-E3) are shown. (F) Flt1 immunostaining in Tg(flt1BAC:yfp) embryos shows co-localization of flt1BAC:yfp with Flt1 antibody staining in spinal cord neurons (boxed). (G) Immunostaining for Flt1 and zn-12 shows Flt1 staining of Rohon-Beard sensory neurons. (H) Overexpression of fli1ep:cherry-sflt1 in Tg(huC:egfp) embryos results in neuronal sFlt1-cherry expression throughout the neural tube. Arrowheads indicate co-localization of huC:egfp with sFlt1-cherry on neuronal cell bodies. (I) Overexpression of kdrl:egfp-sflt1 in Tg(kdrl:hras-mcherry)s896 embryos shows sFlt1-egfp expression in vessels and the neural tube (arrowheads). Nt, neural tube; Se, segmental artery. |
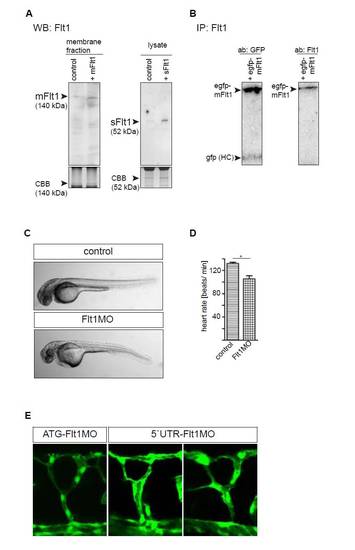
Comparison of ATG and 52 UTR targeting morpholinos, and western blot quantification of Flt1 protein. (A) Western blot analysis of zebrafish embryos using the Flt1 custom-made antibody after in vivo overexpression of mRNA encoding zebrafish mflt1 (left) and sflt1 (right). Note the clear increase in mFlt1 protein and sFlt1 protein after overexpression. (B) Immunoprecipitation analysis of purified GFP-mFlt1 fusion protein after overexpression in HeLa cells. GFP-mFlt1, GFP-zebrafish membrane-bound Flt1 fusion protein; GFP HC, GFP heavy chain. Left lane, detection of GFP signal; right lane, detection of Flt1 protein with custom-made antibody. Note that the custom-made Flt1 antibody detects the zebrafish Flt1 fusion protein. (C) Light microscopy images of control MO-injected embryo and embryo injected with flt1 ATG-targeting MO. (D) Heart rate was higher in control than in flt1 morphants. *P<0.05; Student′s t-test. Error bars indicate s.e.m. (E) Comparison of segmental branching after knockdown of flt1 with the ATG-targeting MO (left) and the 5′UTR-targeting MO (middle and right). Note that both the ATG- and the 5′UTR-targeting MO induced hyperbranching of the segmental artery sprouts. |
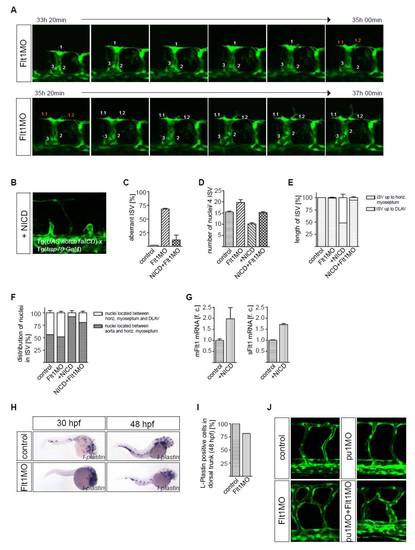
Notch signaling and macrophages in the vascular phenotype of flt1 morpants. (A) Cell tracking in flt1 morphants shows that the endothelial cell leading the segmental sprout gives rise to two progeny cells that display tip cell filopodia characteristics. Embryos were incubated at 26.5°C during confocal imaging. (B) Overexpression of notch1a intracellular cleaved domain (NICD) in control embryos resulted in short segmental artery sprouts. (C) Statistical analysis of segmental vessel development in control (left), flt1 morphants (middle), and flt1 morphants after conditional overexpression of NICD (right) at 48 hpf. Note that overexpression of NICD restored segmental branching in flt1 morphants (right). (D,E) Quantification of endothelial nuclei per four ISV vessel sprouts and segmental sprout length. (F) Distribution of nuclei in the vessel sprout. Note that the distribution of nuclei is not restored in flt1 morphants after overexpression of NICD. (G) Taqman analysis of mflt1 and sflt1 after overexpression of NICD in embryos at 30 hpf. (H,I) Whole-mount in situ hybridization with the macrophage marker l-plastin and quantification of macrophage number. Note the overall reduced expression domain of l-plastin in flt1 morphants compared with controls. At 30 hpf, in flt1 morphants the trunk is almost devoid of l-plastin staining, suggesting that macrophages failed to migrate into this area. (J) Inhibiting macrophage formation by knockdown of pu1 did not affect segmental artery branching. Injection of pu1MO and Flt1MO together did not rescue the vascular branching phenotype. Error bars indicate s.e.m. |
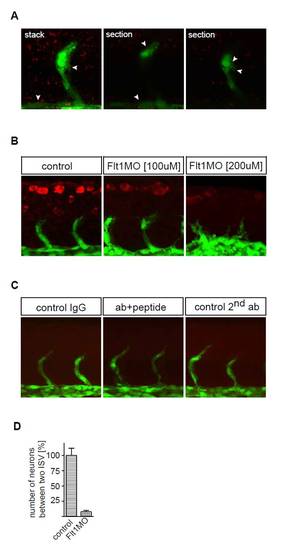
Flt1 immunohistochemistry. (A) Flt1 immunostaining (red) with tyramide signal amplification (TSA) in Tg(fli:egfp)y1 embryos. Note Flt1 immunostaining in the vessel and somite. (B) Flt1 immunostaining (red) in Tg(fli:egfp)y1 embryos in controls (left), after 3 ng flt1 ATG MO (middle) and after 6 ng flt1 ATG MO (right). Note the reduced immunostaining after MO-mediated knockdown of flt1. (C) Negative controls for immunostaining with the custom-made antibody against zebrafish Flt1 protein. Background staining was low in all three negative control immunostaining conditions. (Left) IgG, primary antibody (Ab) was against rabbit IgG. (Middle) Flt1Ab+peptide, embryos were incubated with primary antibody against Flt1 and the protein epitope used to generate the zebrafish Flt1 antibody prior to performing immunostaining. (Right panel) 2nd Ab, primary antibody omitted and stained with secondary antibody only. (D) Quantification of neuronal numbers in Tg(flt1BAC:yfp) × Tg(kdrl:ras-cherry) controls and flt1 morphants (percentage of control). Embryos were evaluated at 48 hpf. Error bars indicate s.e.m. |