
- Title
-
Neuron navigator 3a regulates liver organogenesis during zebrafish embryogenesis
- Authors
- Klein, C., Mikutta, J., Krueger, J., Scholz, K., Brinkmann, J., Liu, D., Veerkamp, J., Siegel, D., Abdelilah-Seyfried, S., and le Noble, F.
- Source
- Full text @ Development
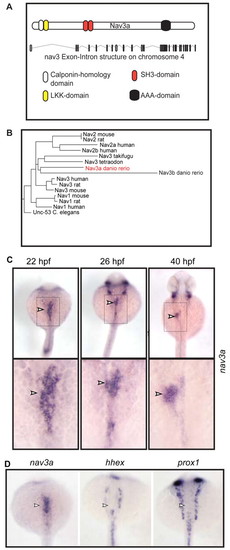
Nav3a is expressed during liver development. (A) Nav3a contains a calponin-homology domain, an LKK-actin binding domain, a putative SH3 domain and ATPase domains of the AAA type. (B) Nav3a is highly related to Nav3 members of other species. (C) Whole-mount in situ hybridization for nav3a in zebrafish embryos. The boxed areas in the upper panels are presented at higher magnification in the lower panels. At 22 hpf, nav3a expression could be detected predominantly in the intestinal endoderm (arrowhead, left panel). Between 26 and 40 hpf, endodermal nav3a expression expands to the newly formed liver bud (arrowhead, middle and right panel). (D) Expression of nav3a and the early liver markers hhex and prox1 analyzed by in situ hybridization in zebrafish embryos at 22 hpf. Nav3a expression could be detected in the foregut endoderm (arrowhead, left panel). hhex and prox1 expression is limited to pancreatic precursors but is not detectable in the presumptive liver bud region (arrowhead, middle and right panel). C and D show dorsal views. EXPRESSION / LABELING:
|
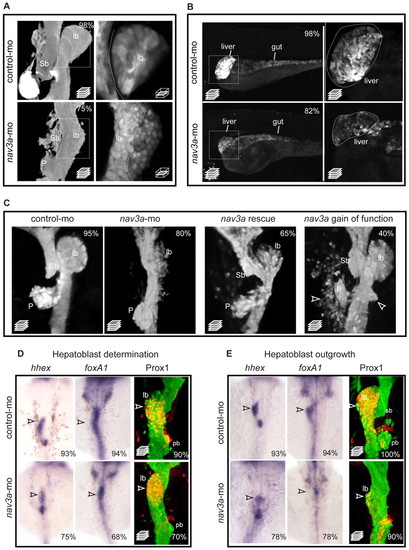
Nav3a depletion reduces liver budding and growth. (A) Representative confocal stack pictures of sox17:gfp embryos shows reduced liver budding in nav3a morphant embryos (lower-left panel) compared with normal liver budding in control morpholino-injected embryos (upper-left panel). In nav3a morphants, hepatoblasts did not separate from intestinal epithelium (lower-right panel) as observed in control embryos (upper-right panel, separation line indicated). Boxed areas in left-hand panels are shown at higher magnification at a single plane in right-hand panels. (B) Representative confocal stack pictures of sox17:gfp embryos shows reduced liver growth in nav3a morphant embryos (lower-left panel) compared with normal liver organogenesis in control morpholino-injected embryos (upper-left panel). Higher magnifications (right) of boxed areas confirmed smaller and irregular shaped livers in nav3a morphant embryos (lower-right panel) compared with control embryos (upper-right panel). (C) Exogenously endodermal nav3a overexpression normalized liver budding defects in nav3a morpholino-injected embryos (third panel) and nav3a overexpression resulted in ectopic budding and dislocated endodermal cells (fourth panel). Arrowheads indicate ectopic endodermal buds or cells. In the Nav3a rescue experiment, a nav3a isoform mutated for the nav3a-ATG morpholino binding site driven by the endodermal specific promoter sox17 was used. Images in A, C are at 40 hpf. Images in B are at 5 days pf. (D) Zebrafish embryos injected with control morpholino (upper panels) or nav3a-ATG morpholino (lower panels) were examined for expression of hhex (26 hpf) and foxA1 (26 hpf) by in situ hybridization and for activated Prox1 by immunofluorescence staining (33 hpf). Before onset of liver budding, hhex and foxA1 expression was only slightly reduced in nav3a morphants. Remaining hhex and foxA1 expression could be detected at the midline (lower panels, arrowheads). Hepatic Prox1 protein activation was not significantly reduced in nav3a morphants (lower-right panel, arrowhead). (E) Analysis of the hepatoblast outgrowth phase at 40 hpf. In nav3a morphants (lower panels, arrowheads), hhex and foxA1 expression domains differed from control embryos (upper panels, arrowheads), and Prox1 was greatly reduced. In nav3a morphants, some hhex and foxA1 expression remained compatible with the presence of a hepatoblast population that failed to migrate laterally. lb, liver bud; sb, swim bladder primordium; P, pancreas; pb, pancreatic bud. The percentage of embryos exhibiting a phenotype as shown is indicated in the right-hand corners. n=150 per group in A,B; n=50 per group in C; n=8-20 per group in D. A and C show ventral view; B shows lateral view; D and E show dorsal view. |
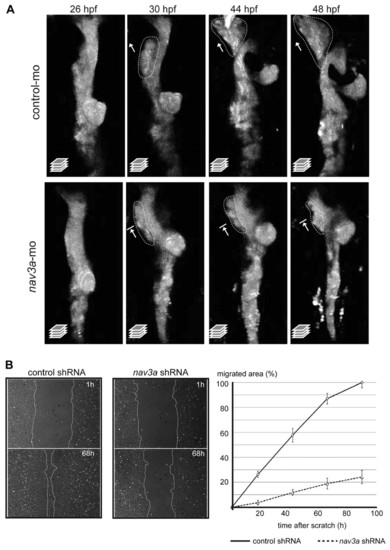
Nav3a controls hepatoblast movement from the intestinal endoderm. (A) Confocal time-lapse imaging of liver development in sox17:gfp embryos 26-48 hpf after injection of control morpholino (upper panels) or nav3a-ATG morpholino (lower panels). In control embryos, the endodermal rod thickened (upper panel, 26 hpf). Subsequently, a cell population on the left side, cranial to the pancreatic bud separated from the intestinal endoderm (upper panel, 30 hpf) and migrated in a leftward direction to form the liver bud (upper panels, 30-48 hpf). Nav3a depletion reduced outgrowth of hepatoblasts resulting in a smaller liver bud (lower panels, 30-48 hpf). All images show a dorsal view; dotted lines demarcate putative hepatoblast populations and arrows depict outgrowth direction. (B) Pac-2 zebrafish cells stably expressing control shRNA or nav3a shRNA were analyzed in an in vitro scratch-migration assay. Confluent monolayers were scratched and at the indicated time points the migrated area was measured in control (B, left panels) and nav3a knockdown cells (B, middle panels). Nav3a depletion significantly reduced the migratory capacity (B, right panel; P<0,001; mean ± s.e.m.); n=6-12 scratched areas from three separate experiments. |
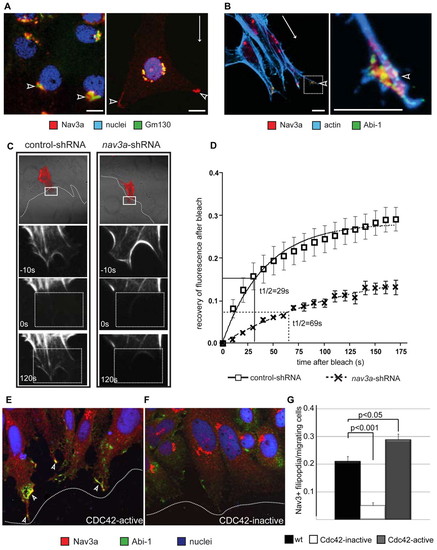
Nav3a regulates actin in cell protrusions of moving cells. (A,B) Nav3a, actin and Abi1 immunofluorescence staining in quiescent and migrating ZFL liver cells. White arrows indicate the direction of migration. In non-migrating cells Nav3a localizes in the Golgi apparatus and here it colocalizes with the Golgi matrix protein gm130 (A, left-hand panel, arrowheads). In migrating cells, Nav3a is localized in distal ends of cell protrusions (A, right-hand panel, white arrowhead). Nav3a, Abi-1 and actin co-localized in distal ends of filipodia and lamellipodia (B, left-hand panel, white arrowheads) of migrating cells. Right-hand panel in B is a higher magnification of the boxed area in the left-hand panel. (C,D) Nav3a regulates actin polymerization dynamics in cell protrusions of migrating cells. Pac-2 cells stably expressing control shRNA or Nav3a shRNA were analyzed for actin polymerization dynamics by the FRAP (fluorescence recovery after photobleaching) assay. Cells were transfected with a vector coding the actin binding protein lifeact-RFP and scratch assays were performed. Representative pictures of fluorescence recovery after photobleaching showed that in Nav3a-deficient cells fluorescence-labeled actin bundles recovered more slowly compared with control cells (C, left-hand panels control; right-hand panels Nav3a deficient). (D) The recovery kinetics of lifeact-RFP after photobleaching, together with the half-life (t1/2) data. n=15 per group, data are presented as mean ± s.e.m. The FRAP experiments were repeated three times. Boxed areas in top panel are shown at higher magnification below. Dotted boxed areas indicate area of photobleaching. (E-G) Cdc42 mediates Nav3a protein translocation to cellular protrusions during cell migration. (E) Pac-2 cells were transfected with a constitutively active form of Cdc42. Activation of Cdc42 resulted in Nav3a translocation to distal ends of filipodia. (F) Transfection of inactive Cdc42-N17 inhibited Nav3a translocation. Arrowheads indicate Abi1-Nav3a double-positive cells. Dotted lines indicate the migration front. (G) Quantification of filipodia formation. n=300 cells per group, data are presented as mean ± s.e.m. |
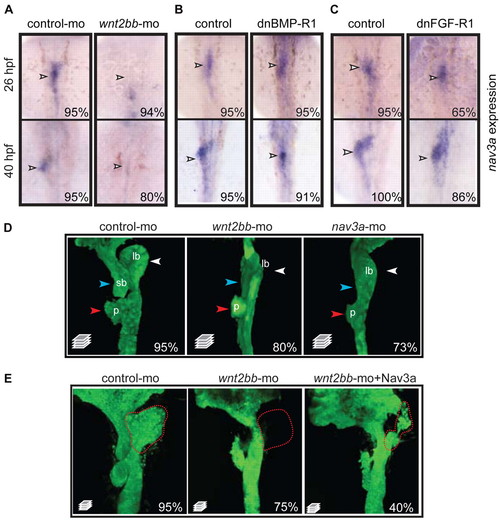
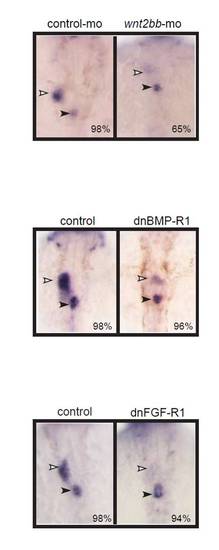
Nav3a expression is controlled by Wnt2bb signaling. (A) Embryos injected with control morpholino or wnt2bb morpholino examined for nav3a expression by in situ hybridization. Wnt2bb inhibition results in reduced nav3a expression in the liver bud (arrowheads). (B,C) Embryos obtained from outcrossing of hemizygous Tg(hsp70l:dnBmpr-GFP) or Tg(hsp70l:dnfgfr1-GFP) zebrafish were heat shocked at 18 hpf, collected at 40 hpf and examined for nav3a expression by in situ hybridization. Inhibition of BMP and FGF receptor signaling did not annihilate nav3a expression (arrowheads) in the liver bud. (D) Wnt2bb depletion phenocopies nav3a depletion. Sox17:gfp embryos injected either with control morpholino (left-hand panel), wnt2bb morpholino (middle panel) or nav3a-ATG morpholino (right-hand panel) examined at 40 hpf by confocal microscopy. Both wnt2bb- and nav3a-morphant embryos developed an aberrant liver bud (white arrowhead). Also the pancreatic bud and the swim bladder primordium did not develop properly (red and blue arrowheads, respectively). (E) Endodermal nav3a overexpression partially rescued wnt2bb inhibition. Sox17-gfp embryos were injected with control morpholino, wnt2bb morpholino alone or wnt2bb morpholino together with sox17-nav3a-mcherry plasmid and analyzed at 50 hpf. Wnt2bb inhibition induced aberrant development of the liver bud, pancreatic bud and swim bladder primordium (middle panel). In 40% of embryos, endodermal nav3a overexpression results in a partial rescue of liver bud formation (right-hand panel). Nevertheless these liver buds appeared to be aberrantly shaped (right-hand panel). Red dotted lines indicate the liver bud. The percentage of embryos exhibiting a similar phenotype as displayed in the figure, is indicated in the lower right-hand corner (A-C: n=10-30 embryos per group; D: n=150 per group, E; n=100 per group). lb, liver bud; sb, swim bladder primordium; p, pancreatic bud. A-C show dorsal view; D and E show ventral view. |
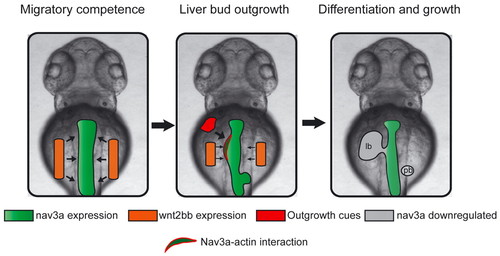
The postulated model. Left: Wnt2bb initiates migratory competence in endodermal cells by controlling Nav3a synthesis in the predetermined intestinal endoderm. Middle: In a second step, FGF and BMP alone or in combination with other ‘outgrowth factors’ might mediate translocation of Nav3a protein from Golgi apparatus to lamellipodia and filipodia in hepatoblasts. There, Nav3a interacts with Arp2/3-Abi1-dependent actin assembly complexes. Subsequently, Nav3a positively modulates actin assembly and thereby enables migrating hepatoblasts to follow their trajectory. Right: Nav3a expression is downregulated after completion of the liver bud. lb, liver bud; pb, pancreatic bud. |
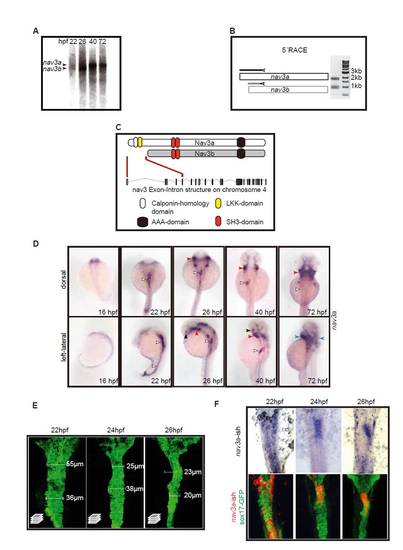
Nav3 isoforms, phylogenetic analysis and expression. (A) Northern blot analysis of whole embryo RNA demonstrated that two nav3 isoforms are expressed during zebrafish development: a longer nav3a (8 kb) and a shorter nav3b isoform (7.3 kb). (B) 52 RACE PCR confirmed the expression of nav3a and nav3b in zebrafish embryos at 22 hpf. Nav3a and nav3b have a divergent first exon, indicating transcriptional regulation by independent alternative promoters. (C) Nav3a, in contrast to Nav3b, contains a calponin-homology domain and an LKK-actin binding domain. Both share a SH3 and ATPase domains of the AAA type. (D) Whole-mount in situ hybridization for nav3a in developing zebrafish embryos. Weak nav3a expression could be detected beginning at 16 hpf. At 22 hpf a maximum expression is detectable in intestinal endoderm and in addition in the posterior endoderm along the trunk (white arrowheads). The intestinal and hepatic endoderm expression remains up to 40 hpf (white arrowheads) but is downregulated after completion of liver budding (white arrowhead, 72 hpf). Beginning at 26 hpf up to 72 hpf an additional expression domain could be observed in the developing pharyngeal arches (red arrowheads), parts of the eye (black arrowheads) and at 72 hpf in the hindbrain and the heart (blue arrowheads). (E) Confocal stacks of sox17:gfp embryos between 22 and 26 hpf demonstrating that the foregut endoderm becomes more compact during this period. (F) Nav3a mRNA expression is restricted to the foregut endoderm. Nav3a was detected by in situ hybridization in sox17:gfp embryos at the indicated time points. Endodermal GFP protein was stained by immunofluorescence in the same embryo. E and F show ventral view. EXPRESSION / LABELING:
|
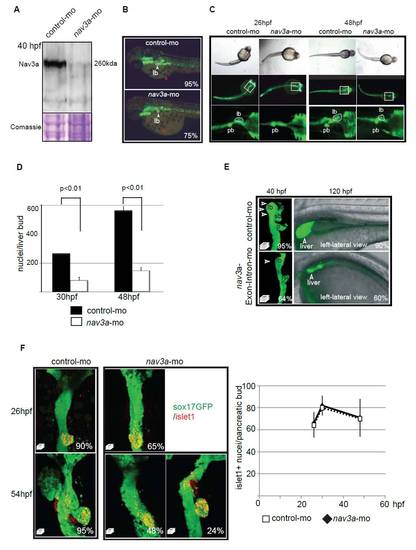
Nav3a morpholino-mediated knockdown affects liver budding without causing growth retardation. (A) Morpholino antisense RNA, targeting the nav3a-ATG region, injected in sox17:GFPs870 one-cell-stage embryos resulted in a robust inhibition of Nav3 protein expression in vivo, as analyzed by Western blot. (B) Nav3a morpholino injections resulted in defective liver budding (liver bud, lb, indicated by the white arrowhead and dotted line) but did not influence pigmentation (red arrowheads). Sox17:GFPs870 embryos injected with control morpholino or nav3a morpholino were examined at 48 hpf for pigmentation as a marker for developmental retardation. The percentage of embryos exhibiting a similar appearance to that shown here is indicated in the lower right-hand corner (n=50 per group). (C) Nav3a-ATG morpholino injections result in defective liver, pancreatic and swim bladder-bud development. General body shape remains normal. Single cell stage sox17:GFPs870 embryos were injected with morpholino antisense RNA, targeting the nav3a ATG region and analyzed by fluorescence and light microscopy. Upper panel: Normal light microscopy pictures showing comparable body shape of control morpholino- and nav3a-ATG morpholino-injected embryos. Middle and lower panel: Predominantly liver-bud, pancreatic-bud and swim bladder-bud development were affected. Other sox17:GFP positive regions like gut and pharyngeal arches, between 26 and 48 hpf, did not differ between control and nav3a morphants. (D) Nav3a depletion resulted in a significantly reduced number of cells in the liver bud: Liver buds of sox17:GFPs870 embryos were imaged by confocal microscopy. Whole-mount DAPI staining of nav3a- and control-morpholino-injected embryos were performed. Confocal stacks spanning the whole liver bud were prepared and nuclei in the liver bud were counted. In each group n=5 embryos were analyzed. Mean ± s.e.m. is plotted. (E) Nav3a depletion by a nav3a splice blocking morpholino resulted in reduced liver budding and growth. Left panel: Dorsal view of liver bud formation at 40 hpf, imaged by confocal microscopy. Representative confocal stack pictures of gut-GFP embryos show reduced liver budding in nav3a morphant embryos (lower-left picture) compared with normal liver budding in control morpholino-injected embryos (upper-left picture). 64% of the analyzed nav3a morphant embryos developed smaller liver buds. In each group n=150 embryos were analyzed. Right panels: Lateral view of liver size at 120 hpf, imaged by confocal microscopy. Representative confocal stack pictures of gut-GFP embryos showed reduced liver growth in nav3a morphant embryos (lower right panel) compared with normal liver organogenesis in control morpholino-injected embryos (upper right panel). 60% of analyzed nav3a morphant embryos at 120 hpf had a smaller liver. In each group n=150 embryos were analyzed. lb, liver bud; sb, swim bladder primordium; p, pancreatic bud. (F) Loss of nav3a affects dorsal pancreatic budding without affecting specification. Sox17:gfp embryos were injected with control- or nav3a-morpholino and the expression domain of the pancreatic marker islet1 was assessed by immunofluorescence. At 26 hpf we observed no difference in the number of pancreatic islet1-positive cells between nav3a morphants and control morpholino-injected embryos (F, upper panels, quantification in right-hand panel). Despite islet1-positive cells being detectable at 30 hpf and 54 hpf, we observed reduced dorsal pancreatic budding in a subgroup (48%) of nav3a morphant embryos (lower-middle panel). In a smaller subset of embryos (24%) pancreatic budding was only slightly affected (lower-right panel). Quantification in right-hand panel: Islet1-positive cells in the dorsal pancreatic bud were counted within confocal stacks of indicated groups. We analyzed n=5 representative embryos per group at each time point. Mean ± s.e.m. are plotted. For all pictures, the percentage of embryos exhibiting a similar expression pattern is indicated in the lower right corner (n=100 embryos/group). E and F show dorsal view. |
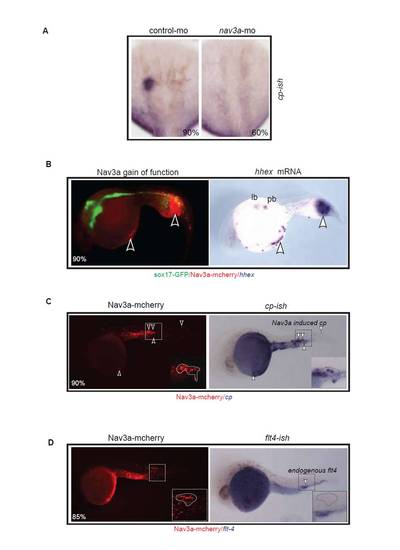
Nav3a overexpression induces ectopic hepatic gene expression. (A) Cp is expressed in the liver bud of control morpholino-injected embryos at 48 hpf. Nav3a morphants show reduced cp expression in 60% of the analyzed embryos. In each group n=30 embryos were analyzed. (B) In the gain-of-function experiments pDestTol2-sox17-nav3aATGmut-mcherry plasmid was injected during single cell stages. Nav3a overexpression induced ectopic endodermal budding and dislocated endodermal cells in the foregut region. Ectopic budding outside of the foregut occurred in the trunk and the yolk sac (left panel). The nav3a positive buds expressed the hepatoblast marker hhex (arrowheads, right panel) (n=20). (C) Nav3a overexpression under control of the endodermal sox17 promoter induces regions of extra endodermal cp-expressing cell clusters. In each group n=50 embryos were analyzed. Ectopic buds were Nav3a-mCherry positive and in 90% of cases we observed cp expression in the ectopic bud (n=20). (D) The vascular marker flt4 (VEGF receptor-3) is not expressed in the ectopic buds (n=5). |
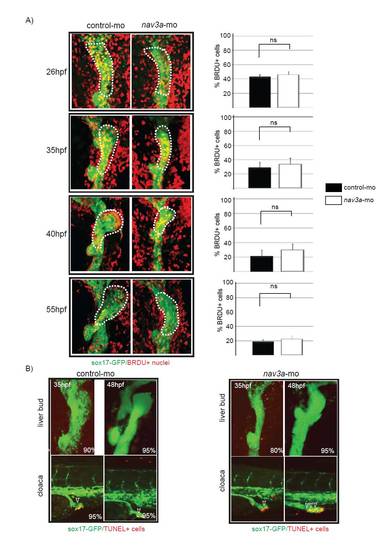
Proliferation and apoptosis are not affected in the liver bud of nav3a morphant embryos. (A) Four hours before the indicated time points BrdU was injected in the yolk sac of control- and nav3a-morpholino-injected sox17:GFP embryos. After harvesting the embryos, BrdU labeling was performed. BrdU-positive cells between the pancreatic bud and the beginning of the pharyngeal endoderm were counted. No significant differences were observed in the relative amount of BrdU-positive cells at (n=5-7/group). Data are expressed as mean ± s.e.m. (B) Apoptosis was analyzed by TUNEL assay. No apoptosis could be detected in the liver bud of control or nav3a morphant embryos (upper panel). By contrast, increased amounts of TUNEL positive nuclei could be detected in intestinal endoderm of the cloaca region of nav3a morphant embryos (lower right panel). The percentage of embryos exhibiting a similar staining pattern is indicated in the lower right corner (n=20 embryos/group). A and B show ventral view. |
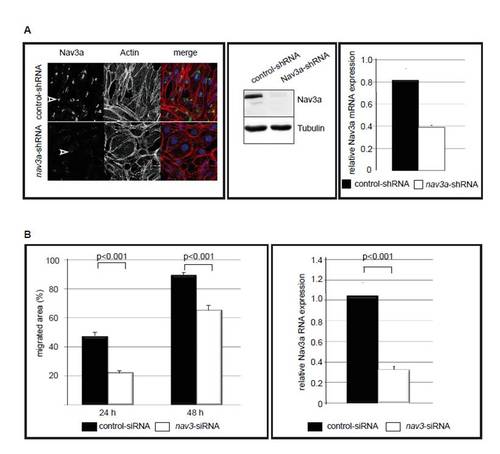
Nav3a depletion reduces cell migration in vitro. (A) Reduced Nav3a-protein and RNA levels in stable Nav3a-shRNA clone. Left: Pac-2 cells stably expressing either control shRNA or Nav3a shRNA were analyzed by immunofluorescence staining for Nav3a protein expression (left pictures and green in merge), actin (phalloidin staining in middle picture and red in merge) and with a nuclear stain (blue in merged picture). In stably expressing Nav3a shRNA cells, Nav3a protein is significantly reduced (white arrowheads). Middle panel: Nav3a protein expression in Pac-2 cells stable expressing control shRNA or Nav3a shRNA analyzed by Western blot. In Nav3a shRNA cells, Nav3a protein is significantly reduced. Right panel: Nav3a mRNA is reduced in Pac-2 cells stably expressing Nav3a shRNA compared with Pac-2 cells stably expressing control shRNA. Nav3a mRNA levels were quantified by real-time PCR and normalized to Elongation factor-1 (EF1) expression as a housekeeping gene. (B) Nav3a regulates migration of human hepatoma cells. Left: Human liver cells (HUH-7) were transfected with Nav3-siRNA and analyzed in an in vitro scratch-migration assay. Confluent monolayers were scratched and at indicated time points the migrated area was calculated. Nav3a inhibition significantly reduced the migratory capacity at 24 hours and 48 hours after transfection. Each graph represents an average of n=6-12 scratched areas, obtained from three separate experiments. Right: Nav3a mRNA is significantly reduced in HUH-7 cells transfected with Nav3a siRNA. Nav3a mRNA levels were quantified by real-time PCR and normalized to 18s RNA expression as a housekeeping gene. Data are expressed as mean ± s.e.m. |
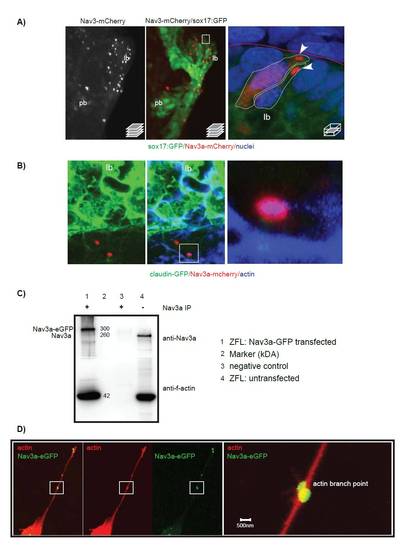
Nav3a protein is expressed in budding hepatoblasts in vivo and interacts physically with actin filaments. (A) Sox17:GFPs870 embryos were injected at the single cell stage with pDest-Tol2-sox17-nav3a-mCherry plasmid allowing imaging of endodermal Nav3a-mCherry expression in vivo. At 40 hpf embryos were fixed and analyzed for endodermal GFP and Nav3a-mCherry protein expression by confocal microscopy. Left: confocal stack showing Nav3a-mCherry protein in the budding liver. Middle: Merged view of the intestinal endoderm (GFP) and endodermal Nav3a-mCherry protein localization. Boxed area indicates the magnified area shown in the right picture. Right: Detailed view of Nav3a-mCherry protein localized in hepatoblast protrusions at the liver budding front (arrowheads). (B) Nav3a interacts in vivo with actin in budding endodermal cells. Claudin-GFP embryos express membrane-linked GFP in the endoderm at 30 hpf. Nav3a-mcherry was overexpressed by injection of pDest-Tol2-sox17-nav3a-mCherry plasmid. Embryos were fixed at 30 hpf and actin was detected by immunofluorescence with phalloidin-Alexa633 staining. (C,D) Nav3a interacts physically with f-actin and binds to actin branching points. ZFL cells were transfected with pDestTol2-CMV-nav3a-eGFP to induce overexpression of Nav3a-eGFP. Whole protein lysate was immune-precipitated with anti-Nav3a antibody. Precipitated protein was analyzed by Western blot for Nav3a and actin expression. As a Western Blot positive control unprecipitated protein lysate was used to verify the anti-Nav3a antibody and anti-actin antibody (lane 4). Lane 1 shows that in pTol-CMV-nav3a-eGFP transfected cells Nav3a-eGFP co-precipitates with actin, demonstrating binding of Nav3a-eGFP to f-actin. (D) Nav3a interaction with acting in spike like protrusions of filipodia extensions in Pac2 cells. A shows ventral view. lb, liver bud; pb, pancreatic bud. |
Depletion of Wnt2bb, BMP or FGF receptor-1 signalling reduced Hhex expression. Sox17:GFPs870 embryos injected with control morpholino (left panels), Wnt2bb morpholino (upper right panel), or embryos obtained from outcrossing of hemizygous Tg(hsp70l:dnBmpr-GFP) (middle right panel) or Tg(hsp70l:dnfgfr1-GFP) (lower right panel) were examined for hhex expression at 48 hpf by in situ hybridization. Depletion of wnt2bb, BMP-R1 and FGF-R1 resulted in reduced hhex expression, indicating that the experimental setup resulted in impaired hepatoblast specification. The percentage of embryos exhibiting a similar expression pattern is indicated in the lower right corner (n=10-20/group). All images are dorsal views. White arrowheads indicate liver bud. Black arrowheads indicate the pancreatic bud. |
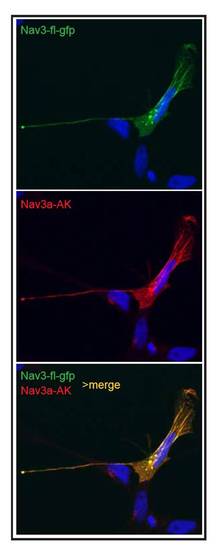
Anti Nav3a antibody specifically detects Nav3a isoform. ZFL cells were transfected with a plasmid coding for full length Nav3a fused to GFP (pDestTol2-CMV-nav3a-eGFP, upper panel). Nav3a full length is detected by Nav3a antibody (middle panel). Lower panel: Merged channels showing colocalization of Nav3a-eGFP signal with Nav3a antibody immune signal, confirms the specificity of the anti-Nav3a antibody. |
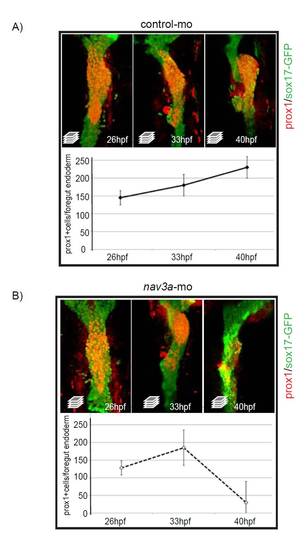
In nav3a morphant embryos hepatoblasts are correctly specified during early developmental stages. (A,B) Sox17:GFPs870 embryos injected with control morpholino (A) or nav3a-ATG morpholino (B) were analyzed for Prox1 expression in the foregut endoderm by immunofluorescence. During the hepatoblast specification phase between 26 and 33 hpf, the number of sox17-Prox1 double-positive cells is comparable between both groups (images in the left and middle panels, quantification in the graph below the photos). At 40 hpf nav3a morphants failed to form a liver bud. During that outgrowth phase nav3a morphant embryos lost Prox1 expression specifically in the region were hepatoblasts failed to grow out of the foregut endoderm (compare upper right panel in A with upper right panel in B). At 40 hpf the number of Prox1-sox17:gfp double-positive cells is reduced in nav3a morphants. All images are ventral views. Graphs show mean ± s.e.m. |
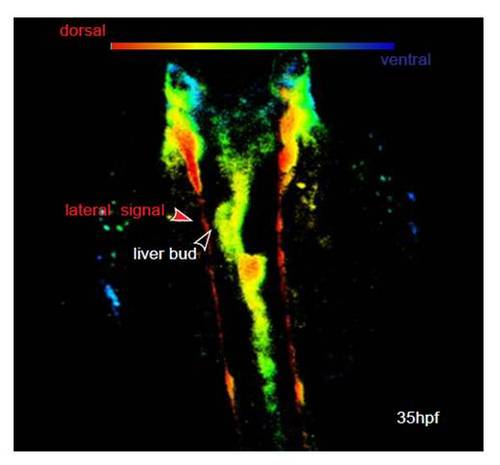
Lateral GFP positive cells (as seen in Movies 1 and 2) are dorsal to the foregut endoderm and are not in contact to the liver bud. Sox17:GFPs870 embryos at 35 hpf imaged by confocal microscopy. Dorsolateral orientation of GFP positive cells in the embryo are indicated by color coding (red, dorsal; blue, ventral). The lateral signal in Movie 1 in the supplementary material is identical to the cells in the dorsal aspect. They are at the dorsal roof of the embryos and not in contact with the foregut endoderm. |
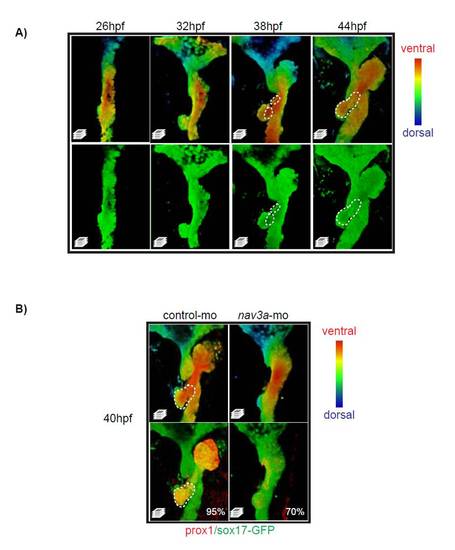
Development of the ventral pancreas in control and Nav3a morphants. Sox17:GFPs870 embryos injected with control morpholino or Nav3a-ATG morpholino were analyzed for Prox1 expression in the ventral pancreas. (A) In controls, the ventral pancreatic bud develops from the foregut endoderm between 38 and 44 hpf. Ventral-dorsal axis is color coded (red, ventral; blue, dorsal). Dashed lines indicates the developing pancreas. (B) Prox1 immunofluorescence at 40 hpf shows that Nav3a is essential for ventral pancreatic budding and Prox1 activation within the ventral pancreas. Note reduced Prox1 expression in pancreatic region of Nav3a morphants. The percentage of embryos exhibiting a similar phenotype as displayed in the figure, is indicated in the lower right corner. |
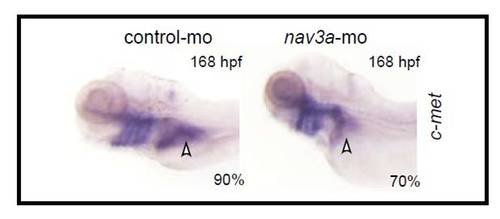
Expression of the liver marker c-Met in controls and Nav3a morphants. Nav3a depletion resulted in reduced hepatic c-Met expression in the growing liver. Embryos injected with control morpholino (left panel) or Nav3a-ATG blocking morpholino (right panel) were examined for expression of c-Met by in situ hybridization. The percentage of embryos exhibiting a similar expression pattern is indicated in the lower right corner (n=20/group). In Nav3a morphants hepatic c-Met expression was greatly reduced at 168 hpf, indicating a reduced liver size (white arrowhead, right panel). The images show a left-lateral view. |