
- Title
-
The serine-threonine kinase LKB1 is essential for survival under energetic stress in zebrafish
- Authors
- van der Velden, Y.U., Wang, L., Zevenhoven, J., van Rooijen, E., van Lohuizen, M., Giles, R.H., Clevers, H., and Haramis, A.P.
- Source
- Full text @ Proc. Natl. Acad. Sci. USA
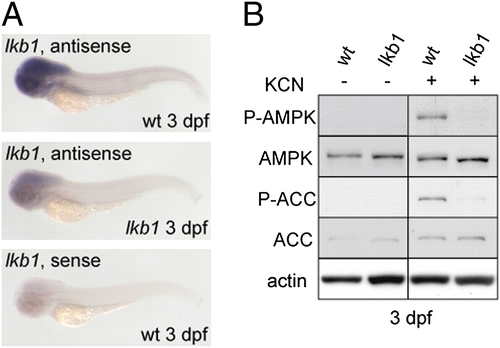
Characterization of zebrafish lkb1 mutations. (A) Whole-mount in situ hybridizations show decreased lkb1 mRNA expression in 3-dpf lkb1-mutant larvae. (B) Western blot analysis of AMPK and ACC upon KCN treatment. KCN treatment results in activation of the AMPK pathway in 3-dpf WT larvae but not in 3-dpf lkb1-mutant larvae. EXPRESSION / LABELING:
PHENOTYPE:
|
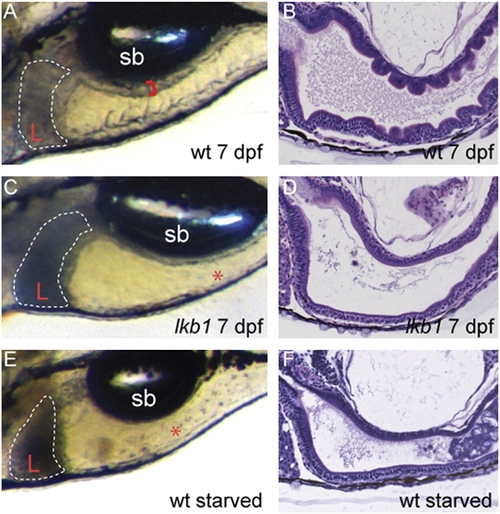
The intestinal architecture of lkb1 mutants resembles that of starved WT larvae. (A, C, and E) High-power images depicting the liver and intestine of live larvae of the indicated genotypes; anterior is to the left. Red brackets demarcate the thickness of the intestinal wall, and livers are outlined. At 7 dpf, lkb1-mutant larvae (C) exhibit a small, dark liver (L) and flattened intestine (asterisk), as do starved 11-dpf WT larvae (E). (B, D, and F) H&E staining of sagittal sections of the intestine. Note loss of intestinal folding in 7-dpf lkb1- mutant larvae and in starved WT larvae. Sb, swim bladder. PHENOTYPE:
|
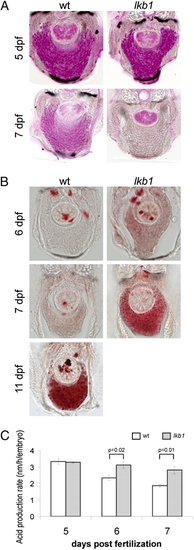
lkb1 mutants exhibit hallmarks of response to starvation and high metabolic rate. (A) Transverse vibratome sections of PAS-stained WT and lkb1-mutant livers at 5 and 7 dpf. At 7 dpf the WT liver still contains a moderate amount of glycogen, but glycogen is depleted in the lkb1-mutant liver. (B) Transverse vibratome sections of ORO-stained WT and lkb1-mutant livers on days indicated. Note strong lipid accumulation in the lkb1-mutnt liver at 7 dpf and in starved WT liver at 11 dpf. (C) Lkb1 mutants exhibit high metabolic rate. Histograms depict acid production rates of WT and lkb1-mutant larvae at different days of development. The rate of acid production correlates with metabolic rate and was calculated as described in SI Materials and Methods. |
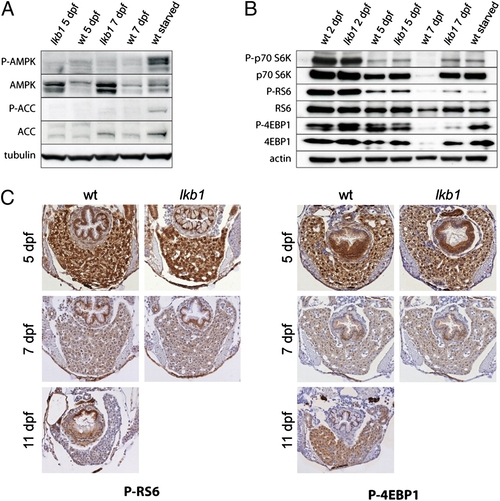
The zebrafish TOR (zTOR) pathway activity in lkb1 mutants resembles that in starved WT larvae. (A) Western blot analysis with antibodies against phospho-AMPK and phospho-ACC of total protein lysates from embryos at the indicated days and genotypes. AMPK and ACC are not phosphorylated in WT or lkb1-mutant larvae at 5 or 7 dpf. Prolonged fasting induces phosphorylation of AMPK and ACC in 11-dpf WT larvae. Elevated expression of AMPK in 7-dpf lkb1-mutant larvae is detected. (B) Western blot analysis using anti–phospho-p70S6K, anti-p70S6K, anti–phospho-4EBP1, anti-4EBP1, anti–phospho-RS6, and anti-RS6 antibodies of total protein lysates from embryos at the indicated days and genotypes. (C) Sections of livers obtained from WT and lkb1-mutant embryos at the indicated days stained with anti–phospho-RS6 and anti–phospho-4EBP1. |
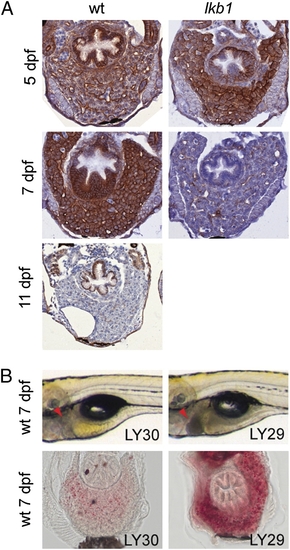
Deregulation of PI3K signaling in lkb1 mutants. (A) Transverse sections of WT and lkb1-mutant livers at indicated days of development stained with an antibody against phospho-AKT. Strong phospho-AKT staining is detected in WT and lkb1-mutant livers at 5 dpf. WT liver is strongly stained at 7 dpf, whereas phospho-AKT staining is barely detectable in 7-dpf lkb1-mutant liver and in starved WT at 11 dpf. (B) Inhibition of PI3K signaling leads to a starvation-like phenotype in WT larvae. WT larvae at 7 dpf treated for 3 d with either LY29 or its inactive analog LY30. LY29 treatment of WT larvae at 4 dpf leads to dark liver (arrowheads) and abnormal hepatic steatosis as revealed by ORO staining. Treatment with the inactive analog LY30 has no effect in the morphology of the larvae. |
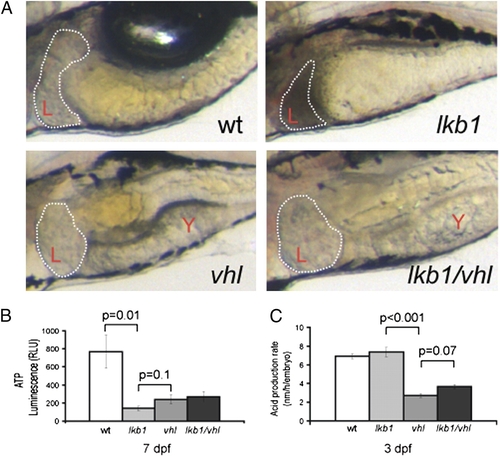
Loss of vhl suppresses manifestation of the lkb1 phenotype. (A) High-power images depicting the liver and intestine of live larvae of the indicated genotypes at 7 dpf; anterior is to the left. Note that some yolk (Y) is still present. The intestine is folded, and the liver is clear in the lkb1/vhl larva. (B) Graph showing ATP levels as measured in relative light units (RLU). The lkb1 embryos have very low ATP levels; ATP levels are decreased in vhl and lkb1/vhl embryos but are slightly higher than in lkb1-mutant embryos. (C) Graph representing the metabolic rate of larvae of different genotypes at 3 dpf. The lkb1-mutant larvae have an increased metabolic rate as compared with WT larvae. The vhl larvae display a dramatically low metabolic rate, and the lkb1/vhl larvae also display a low metabolic rate. PHENOTYPE:
|
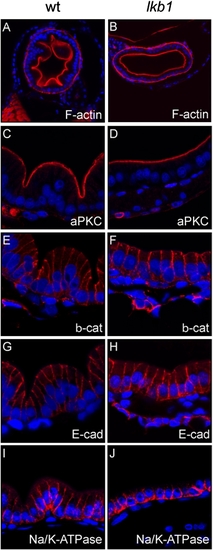
There were no polarity defects in the intestine of lkb1-mutant larvae. Immunofluorescent analysis of transverse sections of the intestinal bulb in WT larvae (A, C, E, G, I, K) and ikb1-mutant larvae (B, D, F, H, J, L) at 7 dpf. Apical localization and levels of F-actin (A and B) and atypical PKC (aPKC) (C and D) are normal in lkb1-mutant larvae. Basolateral localization of β-catenin (E and F), E-cadherin (G and H), and Na/K ATPase (I and J), is not affected in lkb1-mutant larvae. |
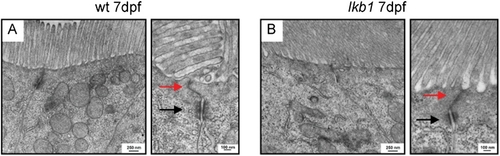
Intact apical brush border and tight junctions in lkb1-mutant intestines. Transmission electron microscope micrographs of WT and lkb1-mutant intestinal cells at 7 dpf. (A) The microvilli constituting the apical brush border are depicted in the intestinal cells. (B) Lkb1-mutant intestinal cells also have microvilli and an apical brush border in their apical surface. Magnifications show hemidesmosomes (black arrows) and tight junctions (red arrows) in WT and lkb1-mutant intestinal cells. |
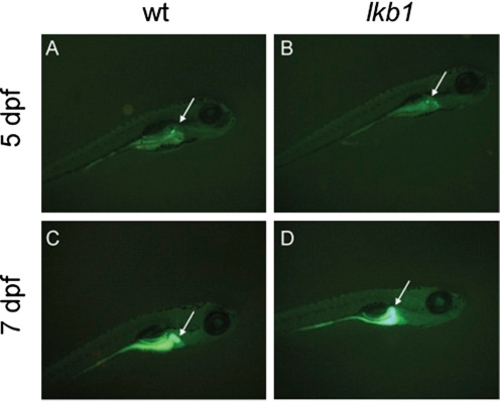
Intestinal lipid processing is intact in lkb1-mutant larvae. Fluorescent live images of WT larvae (A and C) and lkb1-mutant larvae (B and D) incubated with 0.3 g/mL N-{[6-(2,4- dinitrophenyl)amino]hexanoyl}-1-palmitoyl-2-BODIPY-FL-pentanoyl-sn-glycero-3-phosphoethanolamine (PED6) for 2 h. Lateral views, anterior to the right. Cleavage of PED6 by phospholipase A2 (PLA2) relieves intramolar quenching and results in increased fluorescence. Gall bladder fluorescence (arrow in all panels) is observed because of rapid transport through the intestine and hepatobilary systems. In lkb1-mutant larvae, fluorescence in both the intestinal lumen and gall bladder was detected at levels equivalent to those in WT larvae. |
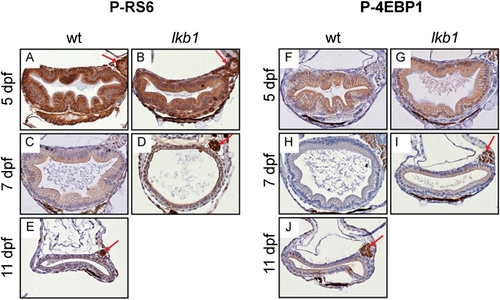
Zebrafish TOR (zTOR) signaling is not grossly deregulated in lkb1-mutant intestine. Transverse sections of WT and lkb1-mutant intestines at indicated days of development were stained with an antibody against phospho-S6 ribosomal protein (RS6, Ser240/244) (A–E) and phospho-4EBP1 (Thr-37/46) (F–J). Strong phospho-RS6 staining is detected in WT and lkb1-mutant intestines at 5 dpf (A and B). Food-deprived WT larvae show moderate staining at 7 and 11 dpf (C and E). Staining in lkb1 mutants (B and D) is not overtly different from staining in age-matched WT larvae (A and C). Moderate phospho-4EBP1 stating is detected in WT and lkb1-mutant intestines at 5 dpf. (F and G). Food-deprived WT larvae show decreased staining at 7 and 11 dpf (H and J). Staining in lkb1 mutants is similar to that in age-matched WT larvae (G and I). Red arrows indicate expression in the pancreas. |
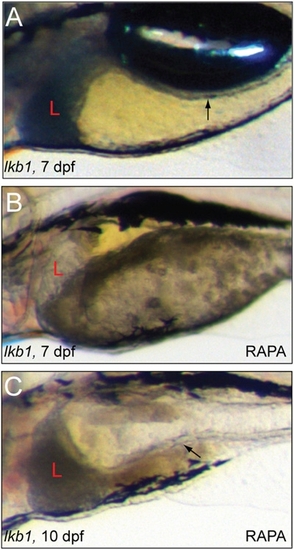
Rapamycin treatment prolongs survival but is not sufficient to rescue the lkb1 phenotype. (A) Untreated lkb1-mutant larva at 7 dpf. Note the black liver (L) and flat intestine (arrow). (B) Rapamycin-treated lkb1-mutant larva at 7 dpf shows a clear liver and some folding of the intestine. (C) Rapamycintreated lkb-mutant larva at 10 dpf. Note the dark liver and flat intestine (arrow). |
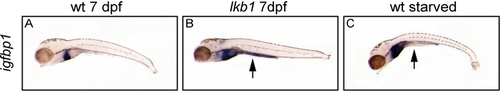
Starvation induces intestinal igfbp1 expression. Whole-mount RNA in situ hybridization with a probe against igfbp1. Lateral views, anterior to the left. (A) WT larvae at 7 dpf. Igfbp1 is expressed in the liver. (B) Lkb1-mutant larva 7 dpf. Igfbp1 is expressed in the liver and intestine. (C) Starved WT larvae at 11 dpf show a staining pattern similar to that in 7-dpf lkb1-mutant larvae. EXPRESSION / LABELING:
|
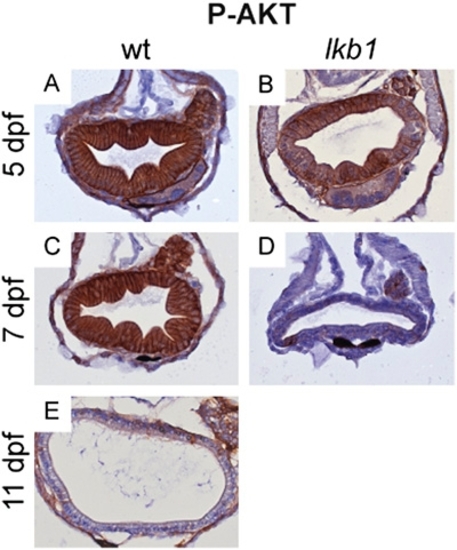
Deregulation of PI3K signaling in lkb1 mutants. Transverse sections of WT and lkb1 intestines at indicated days of development were stained with an antibody against phosphorylated AKT. (A and B) Strong phospho-AKT staining is detected in WT and lkb1-mutant intestines at 5 dpf. WT intestine at 7 dpf is strongly stained (C), whereas in lkb1-mutant intestine at 7 dpf phospho-AKT staining is barely detectable (D). (E) Starved WT larvae at 11 dpf show very little phospho-AKT staining in the intestine. |
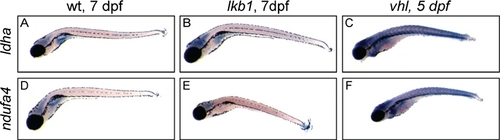
The lkb1-mutant larvae are not hypoxic. Whole-mount in situ hybridization for expression of the hypoxia-inducible factor 1 subunit alpha (HIF1α) target genes ldha and ndufa4 in WT (A and D), lkb1-mutant (B and E) and von Hippel–Lindau (vhl)-mutant (C and F) embryos. Lateral views, anterior to the left. (A) WT embryo at 7 dpf stained for ldha1; expression is detected in the brain. The same pattern is observed in lkb1 embryos at 7 dpf (B), whereas vhl-mutant embryos that exhibit constitutive activation of the hypoxia program show up-regulation of ldha1 expression throughout the embryo (C). (D) WT embryo at 7 dpf showing expression of ndufa4 in the brain. The same pattern is observed in lkb1-mutant embryos at 7 dpf, whereas vhl-mutant embryos show widespread up-regulation of ndufa4 expression. |

Unillustrated author statements |