
- Title
-
Dual Roles of Notch in Regulation of Apically Restricted Mitosis and Apicobasal Polarity of Neuroepithelial Cells
- Authors
- Ohata, S., Aoki, R., Kinoshita, S., Yamaguchi, M., Tsuruoka-Kinoshita, S., Tanaka, H., Wada, H., Watabe, S., Tsuboi, T., Masai, I., and Okamoto, H.
- Source
- Full text @ Neuron
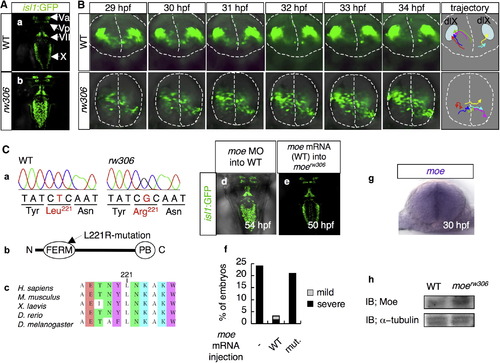
The moerw306 Mutation Affects the Directionality of the Migration of the Vagus Motor Neuron Precursors (A) Fluorescence images of the hindbrains of isl1:GFP transgenic zebrafish at 50 hpf. (a) WT and (b) rw306 mutant. Dorsal view (rostral toward the top) is shown. The following abbreviations are used: Va, anterior trigeminal motor nuclei; Vp, posterior trigeminal motor nuclei; VII, facial motor nuclei; X, vagus motor nuclei. (B) Migration patterns of the vagus motor neuron precursors in the WT (upper) and rw306 mutant (lower) from 29 hpf to 34 hpf. The dotted lines indicate the outlines of the neural tubes and the midlines. The colored arrows in the trajectory panel indicate the trajectories of six arbitrarily chosen vagus motor neuron precursors. dlX is an abbreviation for dorsolateral motor nucleus of the vagus. (C) (a) Sequences of the mutation sites in the WT allele and the rw306 allele. (b) Primary structure of Moe. The arrow indicates the position of the L221R mutation in Moe. The following abbreviations are used: N, N terminus; C, C terminus; PB, PDZ-binding domain. (c) Alignment of the Moe amino acid sequences from various species. The amino acids are colored according to type: blue, polar positive (K); green, polar neutral (T, N); white, nonpolar aliphatic (A, L, I); purple, nonpolar aromatic (Y, W); brown, other (E). (d and e) Dorsal views of the WT embryo injected with moe MO (d; 2.0 mg/ml) at 54 hpf and the moerw306 mutant embryo injected with WT moe mRNA (e; 100 μg/ml) at 50 hpf (rostral to the top). (f) Percentages of embryos with partially fused vagus motor nuclei (gray bars) and completely fused vagus motor nuclei (black bars) at 48 hpf. The embryos obtained from moerw306 heterozygous mutant fish pairs underwent no injection (-), injection with the WT moe mRNA (WT; 100 μg/ml), or injection with the L221R-type moe mRNA (mut; 100 μg/ml). (g) Expression pattern of moe mRNA in the hindbrain at 30 hpf (cross-sectional view, dorsal to the top). (h) Western blotting for detection of the Moe protein in the WT and moerw306 mutant embryos; immunoreactivity for α-tubulin is shown as a loading control. IB is an abbreviation for immunoblot. |
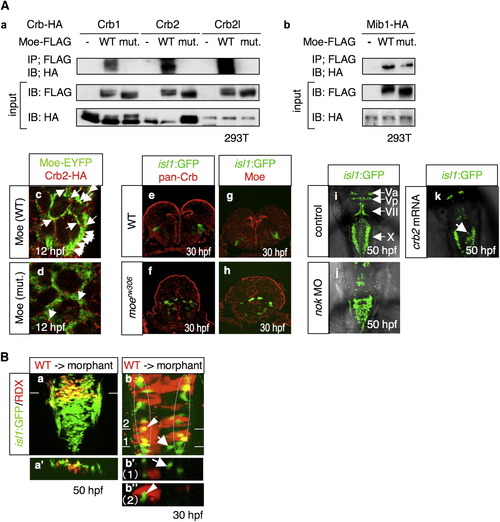
Moe and the Crb Family Proteins Forms a Complex that Is Localized to the Apical Surface of Neuroepithelial Cells (A) (a) Coimmunoprecipitation of Moe-FLAG with Crb1-HA, Crb2-HA, and Crb2l-HA. 293T cells were transfected with a plasmid that encodes HA-tagged Crb1, Crb2, or Crb2l, together with the mock plasmid (-), or the plasmids that encode FLAG-tagged WT Moe (WT) and L221R-type Moe (mut.). (b) Coimmunoprecipitation of Moe-FLAG and Mib-HA. The following abbreviations are used: IP, immunoprecipitation; IB, immunoblot. (c and d) Localization of Crb2-HA (c and d; red), WT Moe-EYFP (c; WT; green), and L221R-type Moe-EYFP (d; mut.; green) in WT neuroectodermal cells at 12 hpf. Arrows indicate the colocalization of Crb2-HA and Moe-EYFP. The mRNAs for these proteins were injected at 60 μg/ml. (e–h) Localization of the Crb family proteins (e and f; red) and Moe (g and h; red) in the WT (e and g) and moerw306 mutant (f and h) embryos at 30 hpf. The vagus motor neurons appear in green (cross-sectional view, dorsal to the top). (i–k) Dorsal view of the embryos injected with the 5-mis-pair control MO (i; 2.5 mg/ml), nok MO (j; 2.5 mg/ml), and crb2 mRNA (k; 500 μg/ml) at 50 hpf. The arrow in (k) indicates the aberrant positioning of the vagus motor neurons. (B) (a and a′) The WT vagus motor neuron progenitors (yellow) were transplanted into the moe morphant hindbrain. The images taken at 50 hpf show the dorsal view (a, rostral to the top) and cross-sectional view (a′; dorsal to the top) at the level of the line shown in (a). (b, b′, and b″) WT cells (red) were transplanted into the dorsomedial region of the moe morphant hindbrain. In this case, at 30 hpf, the morphant vagus motor neuron progenitors have migrated to the correct locations (enclosed by dotted-line), while those neurons that are not surrounded by the WT cells are positioned medially (arrows in b and b′). The images in b′ and b″ are the cross-sectional views (dorsal to the top) of the dorsal views of b (rostral to the top) at the level of line 1 and 2, respectively. Note that some of the morphant-derived vagus motor neurons appear in yellow owing to the fact that (b) shows stacked images. However, they actually appear in green in the cross-section (arrowheads in b and b″). RDX is an abbreviation of rhodamine-dextran. PHENOTYPE:
|
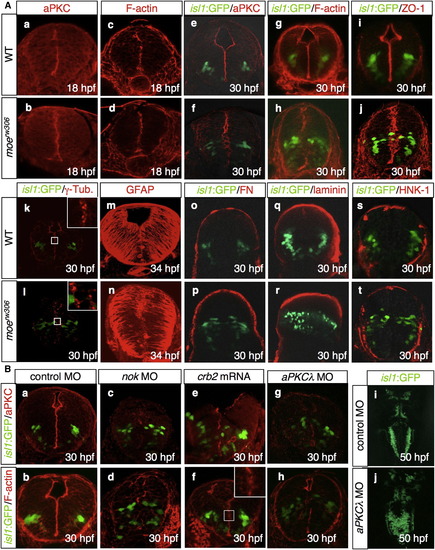
The moerw306 Mutation Affects Neuroepithelial Polarity (A) Visualization of aPKC (a and b; 18 hpf; e and f; 30 hpf; red), F-actin (c and d; 18 hpf; g and h; 30 hpf; red), ZO-1 (i and j; 30 hpf, red), γ-tubulin (γ-Tub; k and l; 30 hpf, red), GFAP (m and n; 34 hpf, red), fibronectin (FN; o and p; 30 hpf, red), laminin (q and r; 30 hpf, red), and HNK-1 antigen (s and t; 30 hpf, red) in the WT (a, c, e, g, i, k, m, o, q, and s) and moerw306 mutant (b, d, f, h, j, l, n, p, r, and t) embryos. The vagus motor neurons are apparent in green (e–l, o–t). Cross-sectional views, dorsal to the top. (B) Visualization of aPKC (a, c, e, and g; 30 hpf, red) and F-actin (b, d, f, and h; 30 hpf, red) in embryos injected with 5-mis-pair control MO (a and b; 2.5 mg/ml), nok MO (c and d; 2.5 mg/ml), crb2 mRNA (e and f; 500 μg/ml), and aPKCλ MO (g and h; 1.0 mg/ml). The vagus motor neurons are apparent in green. Cross-sectional views, dorsal to the top. (i and j) Dorsal views of isl1:GFP embryos injected with the standard control MO (i; 1.0 mg/ml) and aPKCλ MO (j; 1.0 mg/ml) at 50 hpf (rostral to the top). |
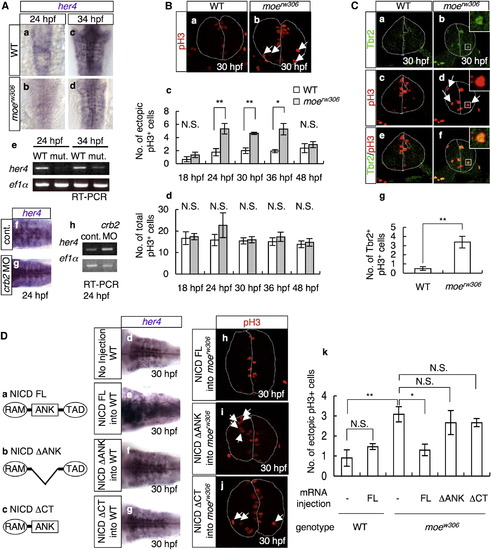
Decreased Notch Activity in the moerw306 Mutant Affects the Position of Mitosis (A) In situ hybridization analysis of her4 in the WT (a and c), moerw306 mutant (b and d), control morphant (f; 50 µg/ml), and crb2 morphant (g; 50 µg/ml) embryos at 24 hpf (a, b, f, and g) and 34 hpf (c and d) (dorsal views; a–d, rostral to the top; f and g, rostal to the left), and RT-PCR analysis of the cDNAs synthesized from the total RNA samples from the whole bodies of WT, moerw306 (mut.), control morphant (cont.), and crb2 morphant (crb2 MO) embryos at 24 hpf and 34 hpf (e and h). (B) Mitotic cells visualized by staining with anti-phospho-histone H3 (pH3; red) of the WT (a) and moerw306 mutant (b) embryos at 30 hpf. Cross-sectional views, dorsal to the top. Arrows indicate mitotic cells that are proliferating away from the ventricular zone. The dotted lines indicate the outlines of the neural tubes and the midlines. (c and d) The number of ectopically dividing cells (c) and the total number of mitotic cells (d) were assessed in 20 μm thick sections. White bars indicate WT; gray bars indicate moerw306 mutant (c and d). Data shown are mean ± SEM; *p < 0.05; **p < 0.01; N.S. is an abbreviation for not significant. (C) Immunohistochemical detection of Tbr2 (a and b; green) and pH3 (c and d; red) in the WT (a and c) and moerw306 mutant (b and d) embryos at 30 hpf. Merged images of the signals associated with Tbr2 and pH3 are shown in (e and f). Cross-sectional views, dorsal to the top. Arrows in (d) indicate mitotic cells that are proliferating away from the ventricular zone. (g) The numbers of Tbr2, pH3-double-immunoreactive cells (Tbr2+, pH3+) at 30 hpf were assessed in 10 μm thick sections. Data shown are mean ± SEM; **p < 0.01. (D) (a–c) Structures of NICD FL (a), NICD ΔANK (b), and NICD ΔCT (c). The following abbreviations are used: RAM, RBP-J association module; ANK, ankyrin repeats; TAD, transactivation domain. (d–g) The levels of her4 mRNA were assessed by in situ hybridization of the WT embryos injected with or without the indicated mRNAs (e and f; 60 μg/ml and g; 20 μg/ml). (h–k) The moerw306 mutants (mut.) were injected with NICD FL (h; 60 μg/ml), NICD ΔANK (i; 60 μg/ml) and NICD ΔCT (j; 20 μg/ml) mRNA species and the numbers of ectopic mitotic cells in 20 μm thick sections were quantified (k). Arrows indicate ectopic mitotic cells; dotted lines indicate neural tubes and midlines. Data shown are mean ± SEM; *p < 0.05; **p < 0.01; N.S. is an abbreviation for not significant. |
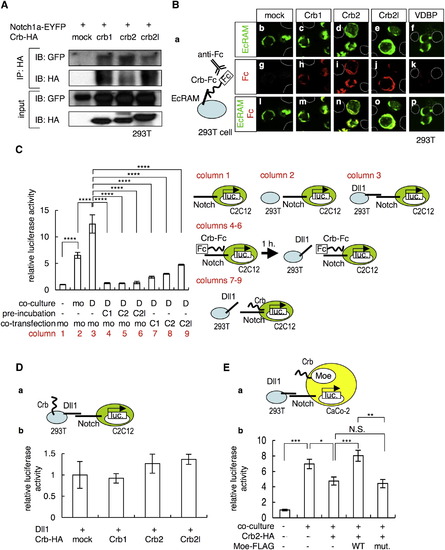
Crb Interacts with the Extracellular Domain of Notch and Inhibits Notch Activity (A) Coimmunoprecipitation of Notch1a-EYFP with Crb1-HA, Crb2-HA, and Crb2l-HA. (B) (a) Schematic of the cell-surface binding assay. 293T cells that overexpressed EcRAM-EYFP (b–f) were incubated with conditioned media prepared from cultures of 293T cells that were transfected with the mock plasmid (g) or with plasmids that encode the Crb1-Fc (h), Crb2-Fc (i), Crb2l-Fc (j), and VDBP-Fc (k) proteins. Merged images of the signals from EcRAM-EYFP (green) and Crb-Fc (red) are shown in (l–p). The dotted lines in (b–p) indicate EcRAM-EYFP-nonexpressing cells. (C) Notch-luciferase reporter assay (left) and schematic of this assay (right). C2C12 cells that were transfected with the Notch-luciferase reporter construct were cultured alone (column 1) or cocultured with 293T cells that were transfected with a mock vector (column 2, mo is an abbreviation for mock) or the Dll1-expressing vector (column 3, D). C2C12 cells transfected with the Notch-luciferase reporter construct were incubated with the conditioned media that contained the Crb1-Fc (column 4, C1), Crb2-Fc (column 5, C2), and Crb2l-Fc (column 6, C2l) proteins, before coculturing with the Dll1-expressing 293T cells. C2C12 cells were transfected with the Notch-luciferase reporter construct together with the mock (column 3, mo), Crb1-HA (column 7, C1), Crb2-HA (column 8, C2), and Crb2l-HA (column 9, C2l) vectors. The data shown are mean ± SEM; ****p < 0.001. (D) (a) Schematic of the luciferase reporter assay depicted in (b). C2C12 cells transfected with Notch-luciferase reporter construct were cocultured with 293T cells that were transfected with the Dll1-expressing vector together with the mock, Crb1-HA (Crb1), Crb2-HA (Crb2), and Crb2l-HA (Crb2l) vectors. The data shown are mean ± SEM. (E) (a) Schematic of the luciferase reporter assay shown in (b). CaCo-2 cells transfected with the Notch-luciferase reporter construct, Crb2-HA, WT Moe-FLAG (WT), and L221R-type Moe-FLAG (mut.) vectors were either cultured alone or cocultured with Dll1-overexpressing 293T cells. The data shown are mean ± SEM; *p < 0.05; **p < 0.01; ***p < 0.005. |
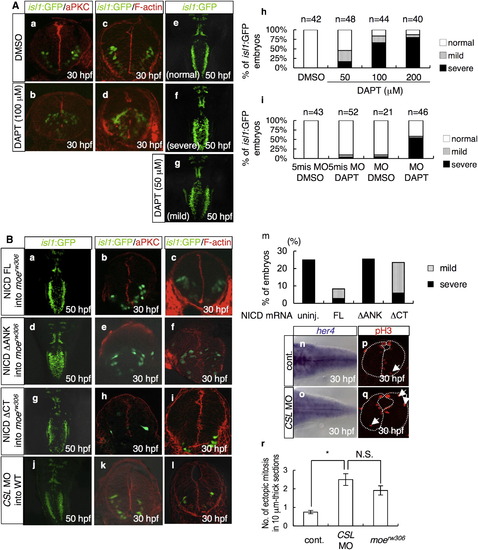
Notch Functions Downstream of Moe to Maintain Neuroepithelial Apicobasal Polarity (A) Visualization of aPKC (a and b) and F-actin (c and d) at 30 hpf, and dorsal views (e, f, and g) at 50 hpf of the embryos treated with DMSO (a, c, and e; 1.0%) or DAPT (b, d, and f; 100 μM: g; 50 μM) from 6 hpf to the indicated developmental stages. (h and i) Percentages of isl1:GFP embryos with bilaterally segregated vagus motor nuclei (normal, open bars, e), partially fused vagus motor nuclei (mild, gray bars, g), and completely fused vagus motor nuclei (severe, black bars, f) at 48 hpf. (h) The isl1:GFP embryos were treated with DMSO (2.0%) or DAPT at the indicated concentrations from 6 hpf to 48 hpf. (i) The isl1:GFP embryos were injected with the 5-mis-pair control MO (5-mis MO; 0.20 mg/ml) or moe MO (MO; 0.20 mg/ml) and then treated with DMSO (0.20%) or DAPT (20 μM) from 6 hpf to 48 hpf. (B) (a–l) The moerw306 mutant embryos (a–i) were injected with the NICD FL (a–c; 60 μg/ml), NICD ΔANK (d–f; 60 μg/ml), and NICD ΔCT (g–i; 20 μg/ml) mRNA species. The WT embryos were injected with CSL MO (j–l; 0.20 mg/ml). These embryos were examined for the formation of the vagus motor nuclei (a, d, g, and j; dorsal views, 50 hpf), neuroepithelial polarity (b, e, h, and k; aPKC, cross-sectional views, 30 hpf), and intercellular junctions (c, f, i, and l; F-actin, cross-sectional views, 30 hpf). (m) Percentages of embryos with partially fused vagus motor nuclei (gray bars) and completely fused vagus motor nuclei (black bars) at 48 hpf. The embryos obtained from moerw306 heterozygous mutant fish pairs underwent no injection (uninj.) or injection with the NICD FL (60 μg/ml), NICD ΔANK (60 μg/ml), and NICD ΔCT (20 μg/ml) mRNA species. (n–r) In situ hybridization of her4 (n and o) and immunohistochemistry of pH3 (p and q) were assessed in the WT embryos injected with control MO (n and p; 0.20 mg/ml) and CSL MO (o and q; 0.20 mg/ml). The number of ectopically dividing cells was assessed in 10 μm thick sections (r). The data shown in (r) are mean ± SEM; *p < 0.05. |
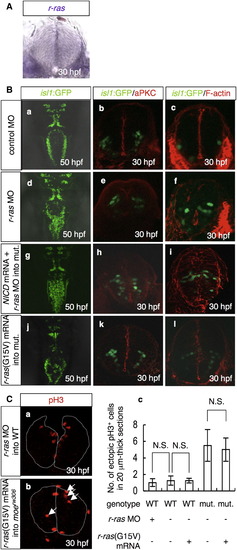
R-Ras Functions Downstream of Moe and Notch to Maintain Neuroepithelial Polarity (A) In situ hybridization for r-ras mRNA at 30 hpf in the WT caudal hindbrain. Cross-sectional view, dorsal to the top. (B) The formation of the vagus motor nuclei (a, d, g, and j, dorsal view, 50 hpf), neuroepithelial polarity (b, e, h, and k; aPKC stain, red; cross-sectional views; 30 hpf), and intercellular junctions (c, f, i, and l; F-actin stain, red; cross-sectional views; 30 hpf) were examined in the isl1:GFP embryos injected with the control MO (a–c; 3.5 mg/ml) or r-ras MO (d–f; 3.5 mg/ml) and in the moerw306 mutants (mut.) injected with NICD FL mRNA (60 μg/ml) plus r-ras MO (g–i; 3.5 mg/ml) or r-ras(G15V) mRNA (j–l; 60 μg/ml). The vagus motor neurons are apparent in green (a–l). (C) The WT (a and c) and moerw306 mutant (b and c) embryos were injected with r-ras MO (a and c) and r-ras(G15V) mRNA (b and c) and stained with anti-pH3 antibody. The number of ectopically dividing cells was assessed in 20 μm thick sections (c). The data shown are mean ± SEM; N.S. is an abbreviation for not significant. |
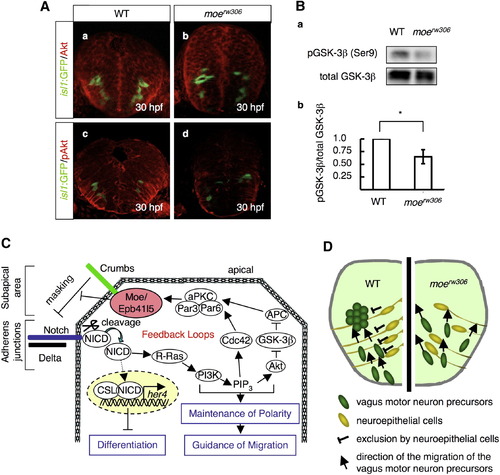
Phosphorylation Levels of Akt and GSK-3β Are Reduced in the moerw306 Mutant (A) Immunohistochemical detection of total Akt (a and b) and phospho-Akt (pAkt; c and d) in the WT (a and c) and moerw306 mutant (b and d) embryos at 30 hpf. The vagus motor neurons are also shown (green). Cross-sectional views, dorsal to the top. (B) (a) Western blotting with anti-total GSK-3β and anti-phospho-GSK-3β (pGSK-3β) antibodies of the WT and moerw306 mutant lysates from 30–34-hpf embryos. (b) The relative intensities of the pGSK-3β bands were quantified with the ImageJ software and normalized to those of the total GSK-3β bands. Data shown are mean ± SEM; *p < 0.05. (C) Schematic of the hypothetical feedback loop, which may function in the maintenance of neuroepithelial polarity. (D) A model for neuroepithelial cell guidance of the migration of the vagus motor neuron precursors. Cross-sectional view, dorsal to the top. |
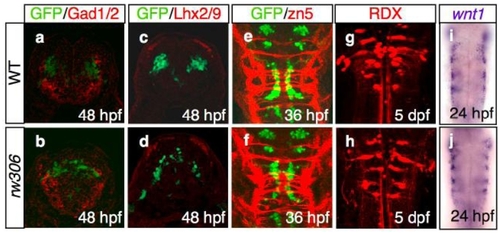
(a-d) The location of the Glutamate decarboxylase 1 and 2 (Gad1/2)-immunoreactive neurons (a,b; red), as well as the LIM homeodomain proteins, Lhx2 and Lhx9 (Lhx2/9)-immunoreactive neurons (c,d; red), which are segmentally positioned in the hindbrain (Ando et al., 2005; Sassa et al., 2007) were examined in the WT (a,c) and rw306 mutant (b,d) embryos. Cross-sectional views, dorsal to the top. The motor neurons are labeled green. Note that the locations of the Gad1/2- and Lhx2/9-immunoreactive neurons were almost normal in the rw306 embryos in the present study. |
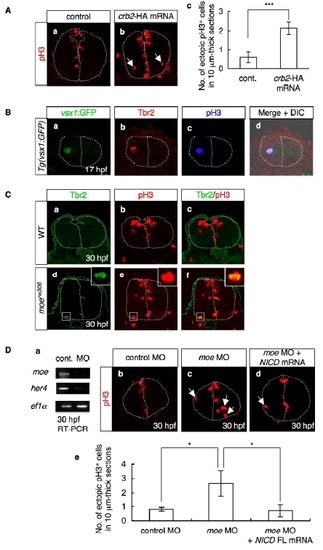
(A) Mitotic cells visualized by staining with anti-pH3 antibody (red) of the control (a) and Crb2-HA-overexpressing (b) embryos at 30 hpf. Cross-sectional views, dorsal to the top. Arrows indicate mitotic cells that are proliferating away from the ventricular zone. The dotted lines indicate the outlines of the neural tubes and the midlines. (c) The number of ectopically dividing cells was assessed in 10-μm-thick sections. Data shown are mean ± SEM; ***, P < 0.005. |
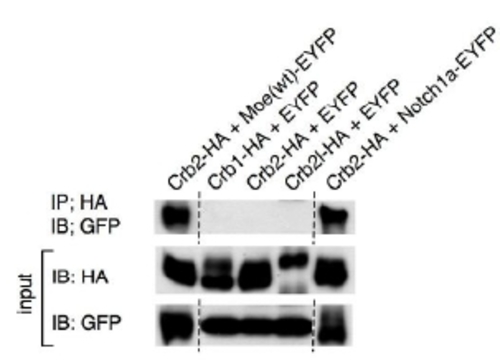
Co-immunoprecipitation of HA-tagged Crb family proteins with EYFP, EYFP-tagged Moe, and EYFP-tagged Notch1a. IP, immunoprecipitation; IB, immunoblot. |
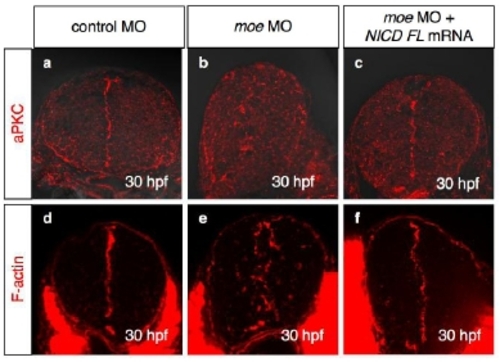
Visualization of aPKC (a-c; red) and F-actin (d-f; red) in the WT embryos injected with control MO (a,d; 2.0 mg/ml), moe MO (b,e; 2.0 mg/ml), and moe MO plus NICD FL mRNA (c,f; 2.0 mg/ml and 60 ng/ml, respectively) at 30 hpf. Cross-sectional views, dorsal to the top. |
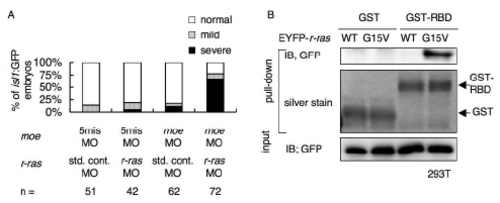
(A) Percentages of isl1:GFP embryos with bilaterally segregated vagus motor nuclei (normal, open bars), partially fused vagus motor nuclei (mild, gray bars), and completely fused vagus motor nuclei (severe, black bars) at 48 hpf. The isl1:GFP embryos were injected with the standard control MO (std. cont. MO; 3.0 mg/ml) or r-ras MO (3.0 mg/ml), and the 5-mis-pair control MO (5mis MO; 0.20 mg/ml) or the moe MO (0.20 mg/ml). |