
- Title
-
A structural and functional ground plan for neurons in the hindbrain of zebrafish
- Authors
- Kinkhabwala, A., Riley, M., Koyama, M., Monen, J., Satou, C., Kimura, Y., Higashijima, S.I., and Fetcho, J.
- Source
- Full text @ Proc. Natl. Acad. Sci. USA
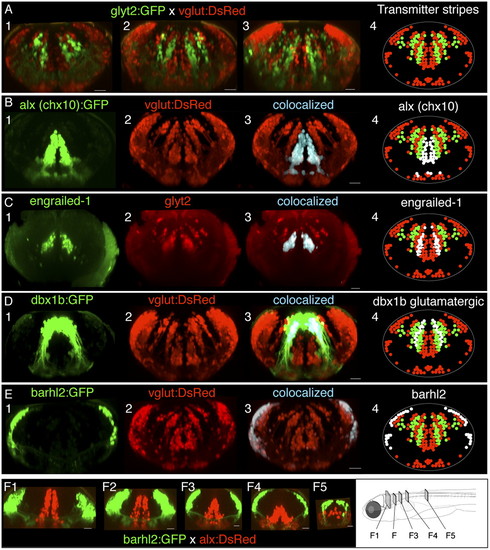
Interleaved transmitter stripes of neurons in hindbrain and their overlap with transcription factor expression patterns. (A) Cross-sections of hindbrain in vivo in rhombomeres 4, 6, and 8 (A, panels 1–3, respectively) from a glyt2:GFP x vglut:DsRed four dpf fish, showing interleaved stripes of glycinergic (green) and glutamatergic neurons (red). (B–E) Transcription factor stripes are present in hindbrain and overlap glutamatergic and glycinergic stripes. (B) Cross-sections from rhombomere 8 of a dual transgenic alx (chx10):GFP and vglut: DsRed three dpf fish shows that alx expression colocalizes with the most medial glutamatergic stripe. (C) Engrailed-1 immunostaining in cross-sections from a glyt2 transgenic line from rhombomere 7 in a 5-dpf fish showing that all medial glycinergic stripe neurons express engrailed-1. (D) Cross-section from rhombomere 7 in a four dpf vglut:DsRed x dbx1b:GFP transgenic fish shows that dbx colocalizes with both the middle glutamatergic stripe as well as a more lateral stripe in a region known to contain glycinergic neurons. (E) Cross-sections from rhombomere 8 in a 4-dpf vglut:DsRed × barhl2:GFP fish indicate that barhl2 staining overlaps the lateral portion of the most lateral glutamatergic populations. (F) Cross-sections of the transformation of transcription factor stripes from hindbrain (F1) to spinal cord (F5) in a cross of barhl2GFP and alx:DsRed lines. White regions in panel 4 in B–E indicate the location of the transcription factor expression relative to the neurotransmitter stripes. All cross-sections are maximum-intensity projections of 20- to 50-μm volumes from a confocal image stack of the entire hindbrain. (Scale bars, 20 μm.) |
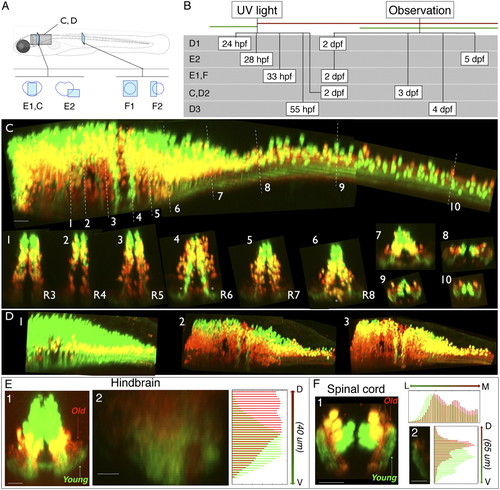
Age-related patterning within the medial glutamatergic, alx hindbrain stripe. (A) Location of images. (B) Timing of experiments. (C) Lateral view of alx:Kaede expression in a photoconverted fish shown from hindbrain through to spinal cord. White dashed lines indicate the rostrocaudal locations of the numbered cross-sections from different rhombomeres (R3–R8) and into spinal cord. (D, panels 1–3) Lateral views of hindbrain/spinal cord regions of alx:Kaede transgenic fish photoconverted/imaged at different times (timing shown in B). In this example we assigned colors so that green cells on the figure had no red in them at the imaging time, and neurons colored red on the figure are those with any red staining (they might also have had green but it was removed to make the youngest, pure green cells obvious). The yellow color here thus does not represent colabeling, but instead red and green neurons that overlap in the z direction. (E, panel 1) Reconstructed confocal cross-section shows that neuropil for older neurons (red) in hindbrain tends to be dorsal to that for younger neurons (green). (E, panel 2) Quantification of relative red/green expression at different dorsoventral locations within a cross-section of neuropil in rhombomere 7 from a different fish than E, panel 1; ventral is at the bottom. Red expression is shifted dorsally relative to green. (F) Photoconversion of an alx:Kaede transgenic fish imaged in spinal cord also shows age-related separation in the neuropil. In F, panel 1, a reconstructed confocal cross-section shows that neuropil for older neurons (red) tends to be medial and dorsal to that of younger neurons (green). (F, panel 2) Quantification of the dorsoventral distribution of red and green expression in the neuropil. (Scale bars, panel 2 in E and F, 10 μm; all other images, 20 μm.) |
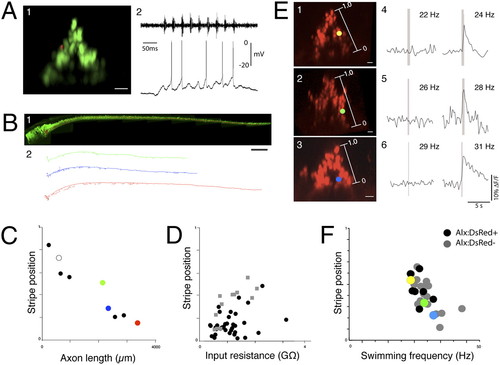
Structural and functional patterning within the alx stripe. (A) Patch recording of an alx:GFP+ neuron in hindbrain segment 7 of a 5-dpf fish, while simultaneously recording motor activity in a ventral root. (A, panel 1) Cross-section view of the patched cell (red) within the alx stripe (green). (A, panel 2) Recording from the alx cell on the left is shown below the simultaneous ventral root recording. (B) Variation in axonal projections into spinal cord of hindbrain alx neurons. (B, panel 1) An example of a reconstruction of a single alx neuron (red) within the alx:GFP transgenic line (lateral view). (A, panel 2) Lateral views of 3D reconstructions of neurons from different dorsoventral locations in the medial glutamatergic stripe in rhombomere 7, with the most dorsal one at the top (normalized dorsoventral positions: 0.51, 0.28, and 0.16 from ventral edge of stripe, rostral to the left). (C) A plot of the total 3D axonal length of 10 labeled alx neurons (two of them overlap, shown with white circle) vs. their dorsal ventral location in the stripe. More ventral neurons have systematically longer axonal length (P < 0.0001). Red, green, and blue points correspond with the three neurons in B. (D) Plot of the input resistance of a neuron vs. its dorsoventral location in a stripe. More-dorsal neurons have systematically higher input resistances in both more- (black dots, P < 0.05) and less-exposed brain preparations (gray squares, P < 0.01). See text for further details. (E) Examples of calcium imaging of alx neurons from different locations in the stripe during different frequencies of swimming in 5-dpf fish. (E, panels 1–3) Cross-sections images of alx:DsRed fish with locations of the neurons (dots) shown relative to the stripes. (E, panels 4–6) Calcium responses of the neurons on the left in two example trials at swimming frequencies near those when the neurons are first recruited. (F) Plot of the minimum swimming frequency at which a neuron responds vs. the dorsoventral location of the neuron, including both alx:DsRed+ alx:DsRed neurons in the region of the alx stripe (P < 0.05 for each correlation). Neurons from Fig. 4B are shown in color. (Scale bars, 200 μm.) |
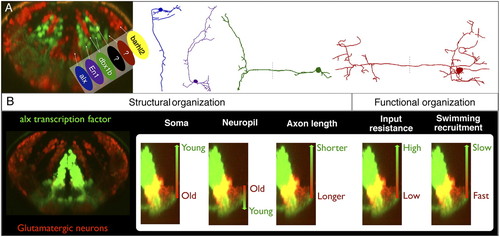
Summary of the structural and functional rules governing hindbrain patterning. (A) Interleaved neurotransmitter stripes overlap with transcription factor expression patterns. Different neuronal morphologies (Right) are associated (by matching colors here) with the different stripes. (B) Within an individual stripe (alx stripe, Left), the somata of neurons are ordered along the axis of the stripe by age, the location of their processes in the neuropil, and their total axonal length. This corresponds to systematic changes in input resistance and recruitment along the axis of the stripe. |