
- Title
-
The habenula prevents helpless behavior in larval zebrafish
- Authors
- Lee, A., Mathuru, A.S., Teh, C., Kibat, C., Korzh, V., Penney, T.B., and Jesuthasan, S.
- Source
- Full text @ Curr. Biol.
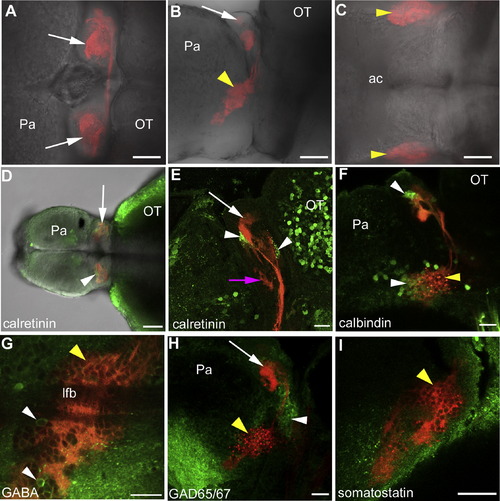
Characterization of KillerRed-Expressing Habenula Afferents (A–C) Forebrain of a KR11 zebrafish in dorsal (A), lateral (B), and ventral (C) views. KillerRed is expressed in axons that innervate the habenula (arrows). Cell bodies of KillerRed-expressing neurons (arrowheads) are in the ventral forebrain (B), in a lateral position (C). (D) Dorsal view of a 2-week-old fish showing calretinin label in restricted habenula neuropils (arrowhead). (E) Sagittal section showing calretinin label in two dorsal habenula neuropils (arrowheads). (F) Lateral view (projection) showing calbindin label in KillerRed-positive neurons (white arrowhead). (G) Lateral view showing rare GABA-positive neurons (arrowheads) in the KillerRed-expressing population. The lateral forebrain bundle is visible in this optical section. (H) Projection of the left side, showing GAD65/67 label in neurons (white arrowhead) dorsal to the KillerRed cluster. (I) Optical section, lateral view, showing lack of somatostatin label in neurons expressing KillerRed. The following abbreviations are used: Pa, pallium; OT, optic tectum; ac, anterior commissure; lfb, lateral forebrain bundle. Scale bars represent 50 μm in (A)–(D) and 20 μm in (E)–(I). Yellow arrowheads indicate KillerRed-expressing cells; white arrows indicate the habenula; pink arrow indicates ventral habenula. Anterior is to the left in all cases. Fish in (F)–(H) are 3 weeks old; fish in (A)–(C), (E), and (I) are 4 weeks old. |
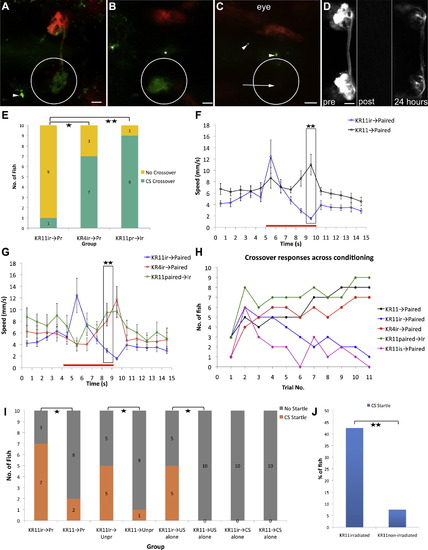
Effect of Photobleaching KillerRed-Expressing Neurons (A) FITC-annexin V label in a KR11 fish 3 hr after photobleaching of the left habenula, in the region marked by the white circle. Annexin V binds only to habenula afferents and not to efferents. Label is visible in axons that terminate in the contralateral habenula, but not in axons that originate from that (nonirradiated) side. One cell (arrowhead), presumably undergoing apoptosis, is labeled outside the irradiated region. (B) Deeper focus of the same fish, showing FITC-annexin V label of the cell bodies in the side that was irradiated. Asterisks indicate sites of FITC-annexin V injection. (C) A fish 5 hr after irradiation of the left habenula. A few cells have taken up acridine orange (arrowheads), but these are not located in the region of cells that had been expressing KillerRed (arrow). (D) Fluorescence recovery of KillerRed after photobleaching. (E) The effect of photobleaching KillerRed-expressing cells on the avoidance response. (F) Mean swim speed in the probe trial for KR11 fish photobleached before conditioning, compared with nonphotobleached fish. (G) Mean swim speed in the probe trial of photobleached KR4 and KR11 fish. (H) Number of fish showing avoidance, as a function of trial number. (I) Number of fish displaying a startle response. (J) Percentage of startle displayed in the probe trial by fish that had been subjected to US during conditioning. All micrographs are dorsal views, with anterior to the left. Fish in (A)–(D) are 3 weeks old. Scale bars represent 20 μm in (A), (B), and (D) and 50 μm in (C). The following abbreviations are used: ir, irradiated; Pr, paired. Error bars indicate SEM. **p < 0.001; *p < 0.05. |
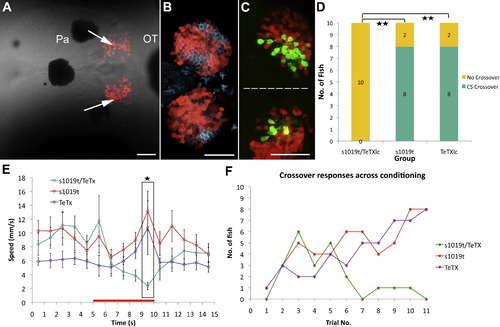
Expression of the Light Chain of Tetanus Toxin in Dorsal Habenula Neurons Prevents Avoidance Learning (A) Kaede expression in habenula neurons (arrows) of an 18-day-old GAL4s1019t/UAS:Kaede fish. This image is a projection of optical sections spanning 90 μm. (B) Expression of Kaede (red) relative to Ron [37] (cyan), a protein found in the dorsal habenula. This image is a projection spanning 18 μm. (C) A 3-week-old triple transgenic (GAL4s1019t/UAS:Kaede/UAS:TeTXlc-CFP). Habenula neurons expressing TeTXlc-CFP (green) are in the medial regions. There is incomplete overlap with Kaede (red) expression. (D and E) Avoidance response (D) and mean swim speed (E) in the probe trial following conditioning with paired CS and US for fish carrying GAL4s1019t/UAS:Kaede/UAS:TeTXlc-CFP, GAL4s1019t/UAS:Kaede, or UAS:TeTXlc-CFP. (F) Avoidance response as a function of trial number. Fish are shown in dorsal view; anterior to the left. Scale bars represents 50 μm. s1019t refers to the GAL4s1019t line. The dotted line in (C) is the midline. Error bars indicate SEM. **p < 0.001; *p < 0.05. |
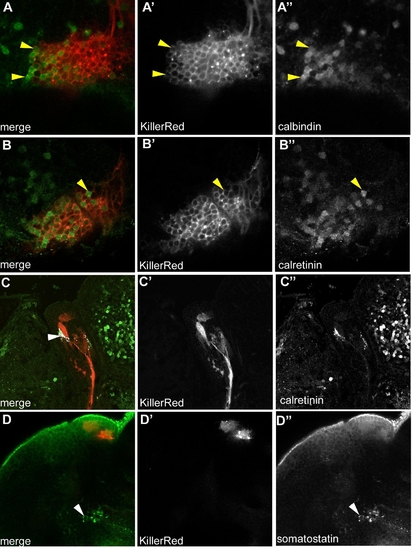
Related to Figure 2. Characterization of Habenula Afferents Expressing KillerRed in KR11 (A) Calbindin and KillerRed in a single optical section of the sample shown in Fig. 2D. Yellow arrowheads indicate cells expressing both calbindin and KillerRed. (B) An optical section of a 3-week old fish, after labeling with an antibody to calretinin (green). Calretinin is visible in KillerRed expressing cells (yellow arrowhead). (C) A sagittal section of a 4-week old fish. Colocalization of calretinin and KillerRed, as analyzed using the colocalization highlighter in imageJ, is indicated in white (arrowhead). (D) A single optical section, lateral view, showing somatostatin in cells that are located medial to the KillerRed expressing cluster. Anterior is to the left in all images. |
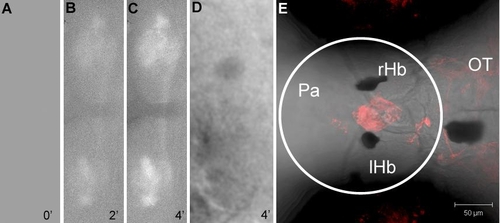
Related to Figure 3. (A-C) Dorsal view of the habenula of a KR11 fish, irradiated after injection of FITC-annexin V into the forebrain. The images show relative change in FITC fluorescence intensity (F/F0) following irradiation with green light. (A) Prior to irradiation. (B) After 2 minutes of irradiation. (C) After 4 minutes of irradiation. (D) The habenula of a nontransgenic fish that had been injected with FITC-annexin V, then irradiated for 4 minutes. There is no signal in habenula afferents. Image processing in panels A-D was carried out using the “F div F0” plugin in imageJ. A Gaussian filter (sigma = 2.0) was used after normalization. (E) Dorsal view of a KR4 transgenic fish. Cells in the circumventricular organ, anterior to the habenula, as well as the parapineal organ, express KillerRed. The region bounded by the white circle was irradiated. A similar region was irradiated in KR11 fish used in behavioral experiments. Pa: pallium; OT: optic tectum; rHb: right habenula; lHb: left habenula. Anterior is to the left. |
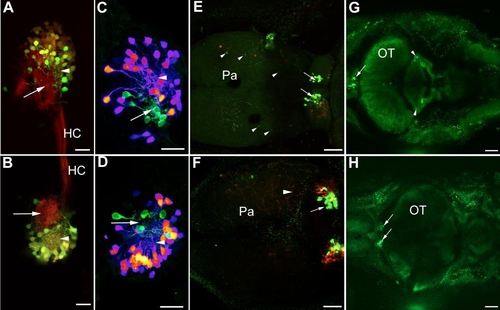
Related to Figure 4. Kaede and TeTXlc-CFP Expression in GAL4s1019t Fish (A and B) Dorsal view of the right (A) and left (B) habenula of a KR11/GAL4s1019t/UAS:Kaede larva. Habenula neurons expressing Kaede (green) extend projections into dorsal habenula neuropils that are innervated by KillerRed expressing axons (arrowheads). The most medial neuropil (arrow) contains very few Kaede-expressing fibers. (C and D) Dorsal view of the right (C) and left (D) habenula of GAL4s1019t/UAS:Kaede/UAS:TeTXlc-CFP fish, examined after conditioning. TeTXlc-CFP neurons (green) extend processes into a more medial location than Kaede-expressing neurons (purple-red-orange). (E-H) Low magnification of GAL4s1019t/UAS:Kaede/UAS:TeTXlc-CFP fish, examined after conditioning. (E and F) TeTXlc-CFP (green; arrowheads) and Kaede (red) are visible in several forebrain neurons. (F) Kaede is expressed in pericytes that associated with vasculature (arrowhead) in this fish. TeTXlc-CFP was detected in pericytes in one fish. (G) TeTXlc-CFP is visible in neurons located in the eminentia granulosum of the cerebellum (arrowheads) of this fish. Similar expression was seen in 3 other fish. (H) A fish with no TeTXlc-CFP in the cerebellum. Speckles outside the CNS are due to scatter from the skin. The arrows indicate expression in the medial region of the dorsal habenula. Pa: pallium; OT: optic tectum; HC: habenular commissure. Anterior is to the left for all images. Bar = 20 μm for panels A-D, 50 μm for panels E, F and 100 μm for panels G, H. All images are projections of z-stacks. |