
- Title
-
Mesendodermal signals required for otic induction: Bmp-antagonists cooperate with Fgf and can facilitate formation of ectopic otic tissue
- Authors
- Kwon, H.J., and Riley, B.B.
- Source
- Full text @ Dev. Dyn.
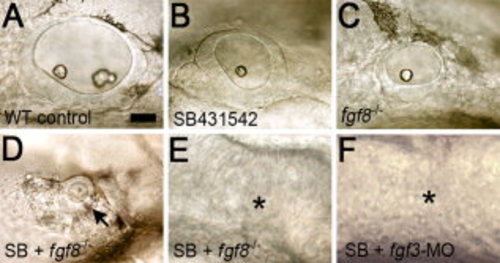
Loss of mesendoderm and fgf8 or fgf3 disrupts otic induction. Lateral views (anterior to left) of otic vesicles in live embryos at 35 hpf. A: Wild-type control. B: Wild-type embryo treated with 100 μM SB431542. C:fgf8-/- mutant. D,E:fgf8-/- mutants treated with 100 μM SB431542 showing either a micro-vesicle (D, arrow) or no morphologically detectable vesicle (E, asterisk). F:fgf3-morphant embryo treated with 100 μM SB431542 showing no morphologically detectable otic vesicle (asterisk). Scale bar = 25 μm. PHENOTYPE:
|
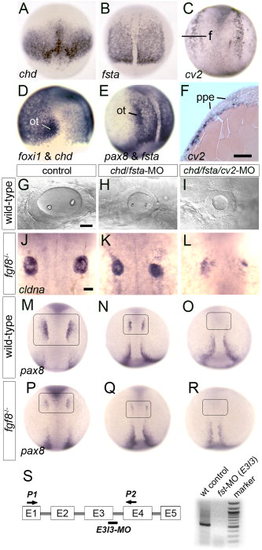
Loss of Bmp-antagonists impairs otic induction. A, D: Expression of chd at 7.5 hpf, dorsal view (A), and chd and foxi1 at 9 hpf, lateral view (D). The preotic domain of foxi1 is indicated (ot). B, E: Expression of fsta at 10 hpf, dorsal view (B) and fsta and pax8, lateral view (E). The preotic domains of pax8 is indicated (ot). C, F: Expression of cv2 at 10.5 hpf as shown in a whole-mount specimen, dorsal view (C) and in cross section (F). The plane of section (f) and preplacodal ectoderm (ppe) are indicated. G–I: Otic vesicle at 26 hpf in a wild-type control (D), chd/fsta double-morphant (E), and chd/fsta/cv2 triple-morphant (F). J–L: Dorsal views of cldna expression in otic cells at 27 hpf in an fgf8-/- mutant (J), fgf8-/- mutant injected with chd/fsta-MO (K), and fgf8-/- mutant injected with chd/fsta/cv2-MO (L). M–R: Dorsal views of pax8 expression in pre-otic cells at 11 hpf (boxed area) in a wild-type control (M), chd/fsta double-morphant (N), chd/fsta/cv2 triple-morphant (O), fgf8-/- mutant (P), fgf8-/- mutant injected with chd/fsta-MO (Q), and fgf8-/- mutant injected with chd/fsta/cv2-MO (R). Anterior is to the top in all images except G–I in which anterior is to the left. Scale bar = 25 μm. S, schematic diagram of the fsta exon/intron structure, the fsta-MO2 target site (bar), primer-binding sites used for RT-PCR (P1, P2 arrows), and the results of RT-PCR confirming that fsta-MO2 injection severely reduces fsta transcript levels. EXPRESSION / LABELING:
PHENOTYPE:
|
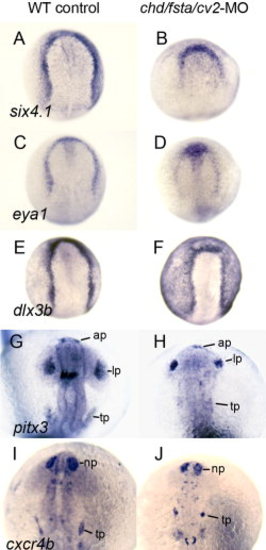
Formation of preplacodal ectoderm and various cranial placodes in chd/fsta/cv2 triple-morphants. A, B:six4.1 expression at 10.5 hpf in a wild-type control (A) and chd/fsta/cv2 triple-morphant (B). C, D:eya1 expression at 10.5 hpf in a wild-type control (C) and chd/fsta/cv2 triple-morphant (D). E, F:dlx3b expression at 10.5 hpf in a wild-type control (E) and chd/fsta/cv2 triple-morphant (F). G, H:pitx3 expression at 19 hpf in a wild-type control (G) and chd/fsta/cv2 triple-morphant (H). The anterior pituitary (ap), lens placode (lp), and trigeminal placode (tp) are indicated. I, J:cxcr4b expression at 19 hpf in a wild-type control (I) and chd/fsta/cv2 triple-morphant (J). The nasal placode (np) and trigeminal placode (tp) are indicated. EXPRESSION / LABELING:
PHENOTYPE:
|
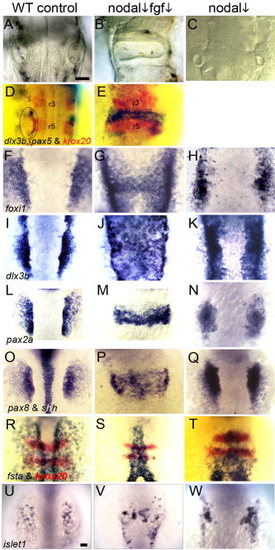
Partial loss of Nodal and Fgf signaling results in medial expansion of otic tissue. In the indicated columns, embryos were treated with 70 μM SB431542 beginning at 0.5 hpf (nodal ↓). A–C: Otic vesicles at 28 hpf in wild-type embryos (A, C), and an fgf8+/- heterozygote (B). D, E: Expression of ear markers dlx3b and pax5 (blue) and the hindbrain marker krox20 (red) at 28 hpf in a wild-type control (D) and a wild-type embryo treated with 1 μM SU5402 beginning at 5.5 hpf (E). F–H: Expression of foxi1 at 11 hpf in wild-type embryos (F, H) and an fgf8+/- heterozygote (G, 2/42 affected). I–K: Expression of dlx3b at 11.5 hpf in wild-type embryos (I, K) and an fgf8+/- heterozygote (J, 4/56 affected). L–N: Expression of pax2a at 12 hpf in wild-type embryos (L, N) and an fgf3+/- heterozygote (M, 7/87 affected). O–Q: Expression of pax8 and shh in wild-type embryos (O, Q) and an fgf8+/- heterozygote (P, 4/51 affected). R–T: Expression of fsta (blue) and krox20 (red) at 11 hpf in wild-type embryos (R, T) and an fgf8+/- heterozygote (S, 40/52 affected). U–W: Expression of islet1 in the trigeminal placode at 11 hpf in wild-type embryos (U, W) and an fgf8+/- heterozygote (V, 3/46 affected). All images show dorsal views (anterior to top). Scale bar = 50 μm. EXPRESSION / LABELING:
PHENOTYPE:
|
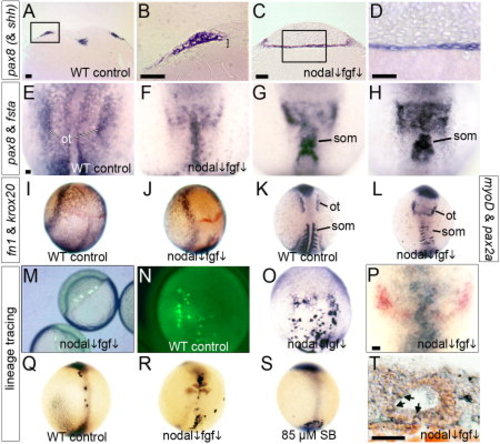
Paraxial cephalic mesoderm transfates to otic tissue in Nodal-Fgf-deficient embryos. A, B: Transverse section of a wild-type control stained for pax8 and shh. B shows an enlargement of the boxed region in A, with the mesodermal layer indicated (bracket). C, D: Transverse section through the otic domain of pax8 in a fgf8+/- heterozygote treated with 70 μM SB431542. D: An enlargement of the boxed area in C. E–H: Double staining for pax8 and fsta expression (dorsal views) in a wild-type control at 11.5 h (E), and wild-type embryos treated with 70 μM SB431542 + 1 μM SU5402 and fixed at 11 hpf (F) or 11.5 hpf (G, H). The normal otic domain of pax8 (ot) and somitic expression of fsta (som) are indicated. I, J: Two-color staining for fn1 (blue) and krox20 (red) at 10 hpf in a wild-type control (I) and a wild-type embryo treated with 70 μM SB431542 + 1 μM SU5402 (J). K, L: Double staining for pax2a and myoD in a wild-type control (K) and a wild-type embryo treated with 70 μM SB431542 + 1 μM SU5402 (L). The otic domain of pax2a (ot) and myoD-expressing somites (som) are indicated. M–T: Lineage-tracing of prospective mesendoderm. Laser irradiation was used to photo-uncage fluorescein-dextran in small clusters of marginal cells of wild-type embryos treated with 70 μM SB431542 + 1 μM SU5402 (M), and embryos were fixed and stained with anti-fluorescein antibody (blue) at 9.5 hpf (O), 13 hpf (P), or 24 hpf (T). Older specimens (P, T) were also stained by whole-mount in situ hybridization for pax2a expression (red). The specimen in T shows a sagittal section (anterior to left) of a medial otic vesicle containing scattered lineage-marked cells (arrows). For comparison, lineage-labeled cells are shown in wild-type controls at 9.5 hpf (N) and 13 hpf (Q), and at 13 hpf in fgf8+/- heterozygotes treated with 70 μM SB431542 (R) or fgf8+/- heterozygotes treated with 85 μM SB431542 (S). The specimen in R also shows krox20 expression (red). Whole-mount specimens show dorsal views with anterior to the top. Scale bar = 25 μm. EXPRESSION / LABELING:
PHENOTYPE:
|
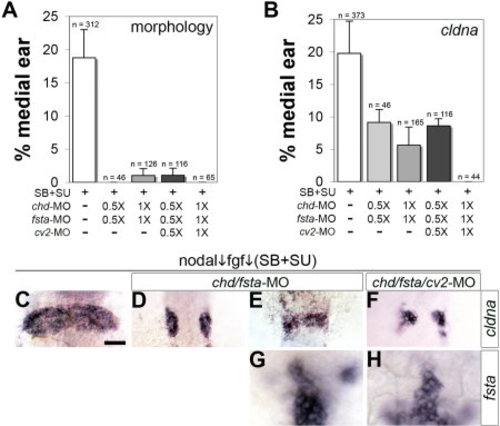
Development of medial otic tissue requires mesendodermal Bmp-antagonists. A, B: Frequency of inhibitor-treated embryos producing medial otic vesicles as determined by morphological criteria (A) or expression of cldna (B). Embryos obtained from outcrosses of oep+/- heterozygotes were treated with 70 μM SB431542 + 1 μM SU5402. Where indicated, embryos were also injected with 2.5 ng chd-MO, 5 ng fsta-MO, and 5 ng of cv2-MO2 (1X), or with half-doses of morpholino (0.5X). Data are presented as the mean and SEM of 2–8 independent experiments, with total sample sizes indicated. C–F: Representative specimens showing cldna expression at 24 h (C–F). G, H: Expression of fsta at 11 hpf shows that paraxial cephalic mesendoderm is not ablated by the combination of SB431542, SU5402, and 1X morpholinos. All images are dorsal views (anterior to top). Scale bar = 50 μm. |
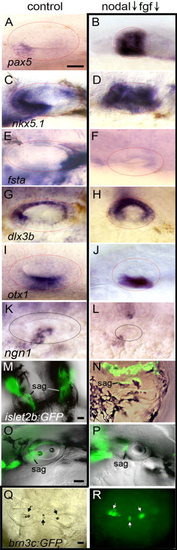
Patterning within medial otic vesicles. Expression of various markers in control embryos, or wild-type embryos treated with 70 μM SB431542 + 1 μM SU5402. A–F: Expression of AP markers pax5 (A, B), nkx5.1 (C, D), and fsta (E, F). G–L: Expression of DV markers dlx3b (G, H), otx1 (I, J), and ngn1 (K, L). M–P: Fluorescence/DIC overlays showing cranial ganglia in live embryos at 28 hpf, as visualized by islet2b:GFP. Neurons of the statoacoustic ganglia (sag) are indicated. Q, R: Bright field and fluorescence images of a live inhibitor-treated specimen at 30 hpf reveals the presence of sensory epithelia, marked by otoliths (Q, arrows) and brn3c:GFP expression in hair cells (R, arrows). Images show lateral views with anterior to the left (A–L, O, and P) or dorsal views with anterior to top (M, N, Q, R). Scale bar = 25 μm. |