
- Title
-
Dynamic Lkb1-TORC1 signaling as a possible mechanism for regulating the endoderm-intestine transition
- Authors
- Marshall, K.E., Tomasini, A.J., Makky, K., Kumar, S.N., and Mayer, A.N.
- Source
- Full text @ Dev. Dyn.
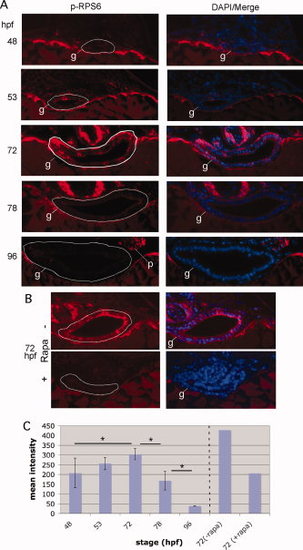
TORC1 is transiently upregulated during the EIT in zebrafish. A: Zebrafish embryos were stained via whole mount immunofluorescence for P-RPS6ser240/244, followed by sectioning in JB-4 and counterstaining with DAPI. The white line delineates the gut epithelium (g). The number of immunopositive cells and staining increases from 48 to 72 hpf, then decreases upon cytodifferentiation of the epithelium. B: To verify that the fluorescent signal is a specific readout of TORC1, we treated embryos with 100 μM rapamycin for 24 hr prior to fixation. This resulted in significant reduction of the immunofluorescence signal. C: Mean fluorescence intensity (grayscale 0-4095) of the epithelium immunostained for P-RPS6ser240/244. Sections shown in A, as well as additional representative sections (total n=4 for each stage), were subjected to histometric analysis using the program Openlab to calculate the mean fluorescence intensity for the intestinal epithelium. For B, only the sections shown were subjected to analysis. *P < 0.05. |
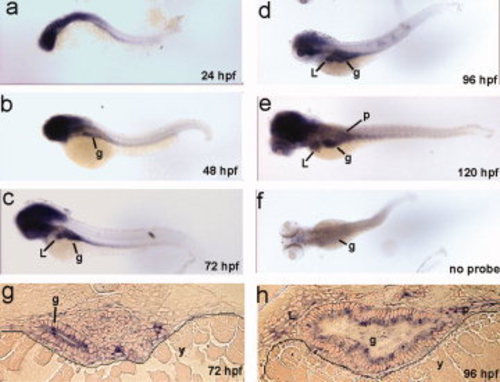
Zebrafish lkb1 is widely expressed. a–f: Whole-mount in situ hybridization to zebrafish lkb1 shown in dorso-lateral view with the head to the left. Background staining was determined by omitting the RNA probe in f. g, h: Histological sections of embryos in c and d, respectively. Solid lines delineate gut tube from the yolk. Original magnification: a-f, 40x; g and h, 400x. g, gut; L, liver; p, pancreas; y, yolk. where is B. |
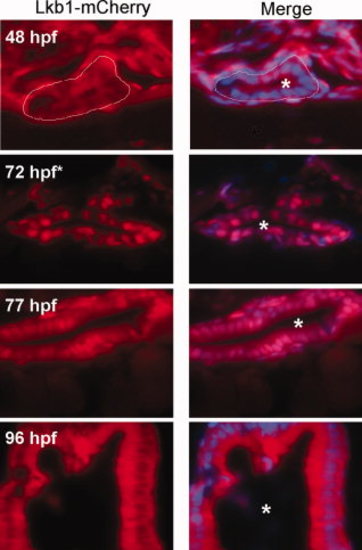
Lkb1 displays dynamic subcellular localization during the EIT in zebrafish. Lkb1 subcellular localization was monitored in a Tg[β-actin: lkb1- mCherry] zebrafish line at 48 hpf, 72 hpf*, 77 hpf, and 96 hpf. Frozen sections were counterstained with DAPI (blue). A white line outlines the gut tube at 48 hpf, and asterisks mark the gut lumen. Original magnification: 630x. |

Co-imaging of Lkb1 localization and TORC1 activation. Zebrafish expressing Lkb1-mCherry (red) at the indicated stages were immunostained for P-RPS6ser240/244 (green). The stages shown represent pre-, mid-, and early post-EIT. At 55 hpf, Lkb1 is diffusely present in the scant cytoplasm of intestinal epithelial cells, though it can be seen in the nuclei of various other cell types outside the intestine. Staining for P-RPS6ser240/244 is low relative to surrounding tissue. At 72 hpf, Lkb1-mCherry is seen in the nuclei of most of the intestinal epithelial cells, and P-RPS6ser240/244 immunostaining is increased relative to 55 hpf. At 84 hpf, nuclear localization of Lkb1-mCherry is sporadically seen in the epithelium, and most (though not all) of those cells stain positive for P-RPS6ser240/244. A white line encloses the gut epithelium. Original magnification, 200×. Insets, 600×. e, epithelium; m, mesenchyme. EXPRESSION / LABELING:
|

Knockdown of lkb1 stimulates epithelial cell proliferation and growth. A: Histological sections through the intestine of uninjected, spl morphant, and ATG morphant, embryos at 48, 72, and 96 hpf. At 48 hpf, the gut lumen is outlined by solid black line. g, gut. Shown are representative sections that correspond to the median gut size as determined by morphometry and depicted in the bar graph. Sections were stained with H&E and original magnification was 400x. B: Depiction of morphometric analysis for cell number and cell shape (height-to-width ratio) using 25 embryos per treatment. A-P positions were matched between embryos using standard anatomic landmarks (pancreatic islet, gall bladder, neural tube). C: Analysis of proliferation rate by BrdU incorporation comparing uninjected (black squares) and spl morphant (white squares) at 48, 72, and 96 hpf. Significance was determined using Student′s two-tail, unpaired t-test (n=25 embryos). *P < 0.05; **P < 0.005. |
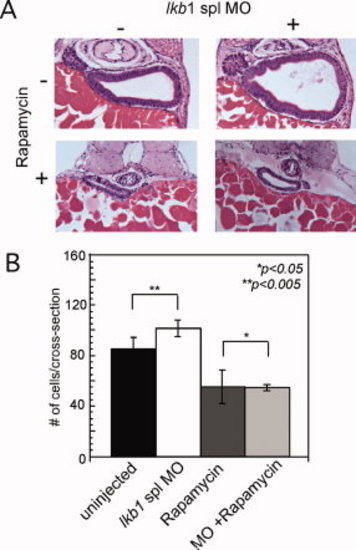
Lkb1 regulates intestine size via TORC1. A: Histological analysis of intestine at 96 hpf in lkb1 spl morphants in the presence and absence of rapamycin. Sections were stained with H&E. Original magnification: 400x. B: Morphometric analysis of cell number showing no morphant phenotype in the presence of rapamycin (n=6 embryos). PHENOTYPE:
|
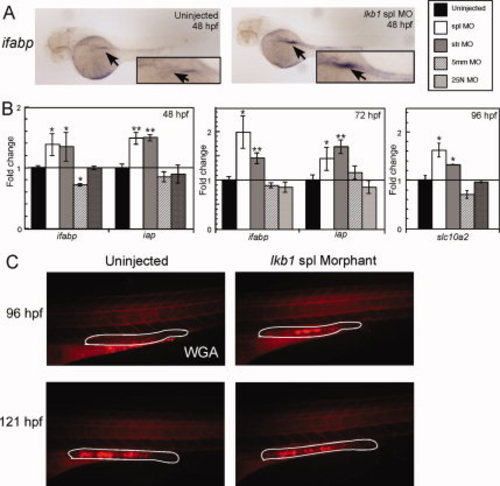
Knockdown of lkb1 induces precocious expression of intestinal markers. A: In situ hybridization to intestinal fatty acid binding protein (ifabp) at 48 hpf. Arrow indicates the gut tube, showing increased expression in the lkb1 morphant. Original magnification, 40x. B: Relative mRNA expression of intestinal markers ifabp and iap at 48 and 72 hpf, and slc10a2 at 96 hpf in uninjected, spl, ATG, 5 mm, and 25N determined by qRT-PCR. Samples were run in triplicate and normalized to ef1α to control for total RNA. Significance was determined using Student′s two-tail, unpaired t-test. C: Rhodamine-conjugated wheat germ agglutinin (WGA) staining for goblet cells in the uninjected and lkb1 spl morphant at 96 and 121 hpf. Very few goblet cells are visible in the control embryo, whereas the morphant displays a much brighter signal. At 121 hpf, the fluorescent signals are qualitatively similar between control and morphant. White line encircles the hindgut. Original magnification: 40x. EXPRESSION / LABELING:
|
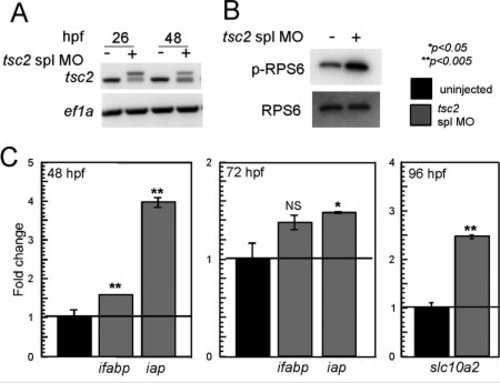
Tsc2 knockdown induces precocious expression of intestinal markers. A: RT-PCR demonstrating knockdown of tsc2 in spl MO-injected embryos. B: Western blot of extract from tsc2 spl morphants at 53 hpf for P-RPS6ser240/244, showing upregulation of TORC1 signaling. C: qRT-PCR of tsc2 morphant RNA for markers of intestinal differentiation showing upregulation of ifabp and iap expression at 48 and 72 hpf, and slc10a2 at 96 hpf. Samples were normalized to ef1α and significance was determined using Student′s two-tail, unpaired t-test. |
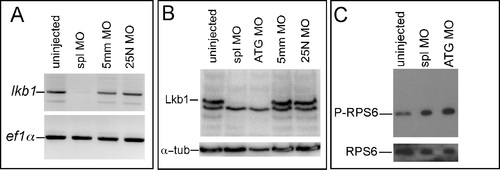
Morpholino-mediated knockdown of lkb1. A: Western blot analysis of uninjected, spl morpholino- (spl MO), ATG morpholino- (ATG MO), 5 base pair mismatch morpholino- (5 mm MO), and a random 25-mer morpholino-injected (25N MO) samples at 72 hpf. Lkb1 is predicted to have a molecular weight of approximately 50 kD. A second invariant, morpholino-insensitive band is detected at approximately 46 kD. Blots were stripped and probed for α-tubulin as loading control. B: RT-PCR comparing uninjected, spl morphant, 5 mm morphant, and 25N morphant samples at 72 hpf. Samples are normalized to ef1α. C: Western blot analysis of P-RPS6 ser240/244 levels in uninjected, spl MO, and ATG MO samples at 72 hpf, showing induction of phosphorylation in the lkb1 morphant embryos. The blot was stripped and probed with antibody to RPS6 for loading control. |
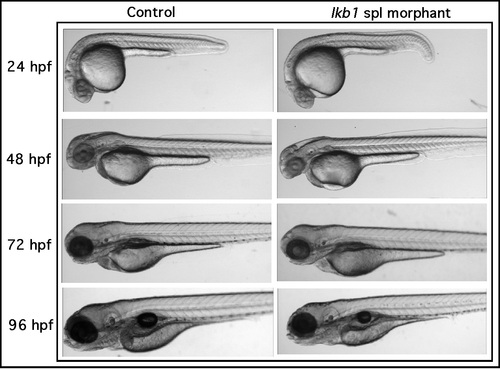
Live stereomicroscopy of lkb1 morphants. Comparison of uninjected and lkb1 spl morphants at 24, 48, 72, and 96 hpf. Original magnification: 40x. |
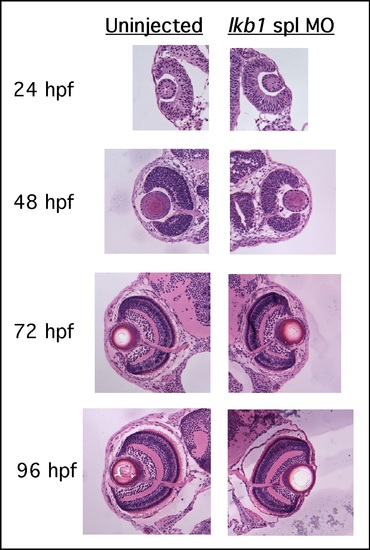
Histological examination of lkb1 morphant eye development. Comparison of uninjected and lkb1 spl morphant eye development at 24, 48, 72, and 96 hpf shows slight delay at 48 hpf, and mildly decreased size at 72 and 96 hpf. This is contrary to accelerated gut development in lkb1 morphants (see main text), indicating that embryonic development is not globally accelerated. Sections were stained with H&E. Original magnification: 40x. |